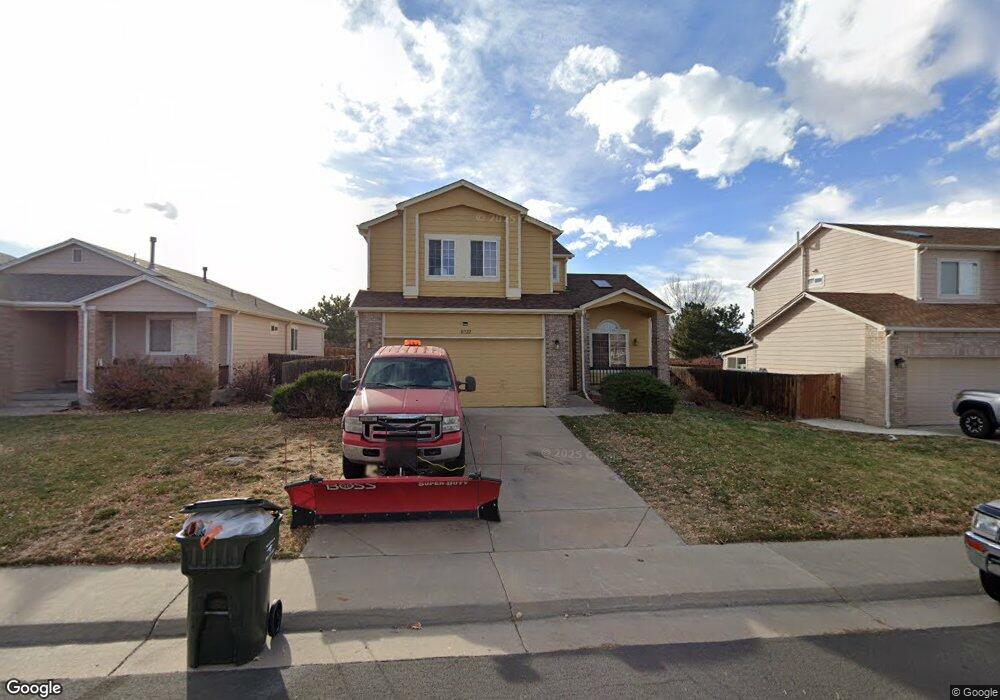
18522 E Bates Dr Aurora, CO 80013
Seven Hills NeighborhoodEstimated Value: $488,859 - $532,000
3
Beds
3
Baths
2,759
Sq Ft
$185/Sq Ft
Est. Value
About This Home
This home is located at 18522 E Bates Dr, Aurora, CO 80013 and is currently estimated at $509,715, approximately $184 per square foot. 18522 E Bates Dr is a home located in Arapahoe County with nearby schools including Arrowhead Elementary School, Horizon Middle School, and Smoky Hill High School.
Ownership History
Date
Name
Owned For
Owner Type
Purchase Details
Closed on
Sep 14, 2023
Sold by
Chang Susan
Bought by
Um Patrick
Current Estimated Value
Home Financials for this Owner
Home Financials are based on the most recent Mortgage that was taken out on this home.
Original Mortgage
$445,665
Outstanding Balance
$434,936
Interest Rate
6.96%
Mortgage Type
FHA
Estimated Equity
$74,779
Purchase Details
Closed on
May 27, 2011
Sold by
Um Chan Y and Chang Susan
Bought by
Chang Susan
Home Financials for this Owner
Home Financials are based on the most recent Mortgage that was taken out on this home.
Original Mortgage
$108,039
Interest Rate
4.81%
Mortgage Type
New Conventional
Purchase Details
Closed on
Apr 9, 2001
Sold by
Holiday Home Builders Inc
Bought by
Um Chan Y and Chang Susan
Home Financials for this Owner
Home Financials are based on the most recent Mortgage that was taken out on this home.
Original Mortgage
$168,000
Interest Rate
7.1%
Create a Home Valuation Report for This Property
The Home Valuation Report is an in-depth analysis detailing your home's value as well as a comparison with similar homes in the area
Home Values in the Area
Average Home Value in this Area
Purchase History
| Date | Buyer | Sale Price | Title Company |
|---|---|---|---|
| Um Patrick | $480,000 | First Integrity Title | |
| Chang Susan | -- | None Available | |
| Um Chan Y | $210,392 | -- |
Source: Public Records
Mortgage History
| Date | Status | Borrower | Loan Amount |
|---|---|---|---|
| Open | Um Patrick | $445,665 | |
| Previous Owner | Chang Susan | $108,039 | |
| Previous Owner | Um Chan Y | $168,000 |
Source: Public Records
Tax History
| Year | Tax Paid | Tax Assessment Tax Assessment Total Assessment is a certain percentage of the fair market value that is determined by local assessors to be the total taxable value of land and additions on the property. | Land | Improvement |
|---|---|---|---|---|
| 2025 | $2,460 | $31,907 | -- | -- |
| 2024 | $2,169 | $31,357 | -- | -- |
| 2023 | $2,169 | $31,357 | $0 | $0 |
| 2022 | $1,978 | $27,306 | $0 | $0 |
| 2021 | $1,990 | $27,306 | $0 | $0 |
| 2020 | $1,992 | $27,735 | $0 | $0 |
| 2019 | $1,922 | $27,735 | $0 | $0 |
| 2018 | $1,592 | $21,593 | $0 | $0 |
| 2017 | $1,569 | $21,593 | $0 | $0 |
| 2016 | $1,499 | $19,343 | $0 | $0 |
| 2015 | $1,426 | $19,343 | $0 | $0 |
| 2014 | -- | $14,719 | $0 | $0 |
| 2013 | -- | $15,290 | $0 | $0 |
Source: Public Records
Map
Nearby Homes
- 18931 E Brunswick Place
- 2824 S Walden Way
- 2970 S Yampa Way
- 18456 E Bethany Place
- 18522 E Linvale Place
- 18893 E Cornell Ave
- 18170 E Bethany Place
- 3076 S Yampa Way
- 18483 E Colgate Cir
- 18726 E Yale Cir Unit E
- 17940 E Brown Place
- 18727 E Yale Cir Unit B
- 3233 S Zeno Ct Unit E
- 3241 S Yampa Way Unit H
- 2585 S Truckee Way
- 2758 S Cathay Ct
- 18766 E Yale Cir Unit A
- 17867 E Cornell Dr
- 3257 S Biscay Way
- 2521 S Bahama Cir Unit F
- 18512 E Bates Dr
- 18532 E Bates Dr
- 2837 S Tower Way
- 18523 E Bates Dr
- 18531 E Bates Dr
- 18513 E Bates Dr
- 2845 S Tower Way
- 18511 E Bates Dr
- 18541 E Bates Dr
- 2847 S Tower Way
- 18545 E Bates Dr
- 2846 S Yampa Way
- 2836 S Tower Way
- 2903 S Argonne St
- 2913 S Argonne St
- 2856 S Tower Way
- 2923 S Argonne St
- 2856 S Yampa Way
- 2891 S Argonne St
- 2857 S Tower Way
Your Personal Tour Guide
Ask me questions while you tour the home.