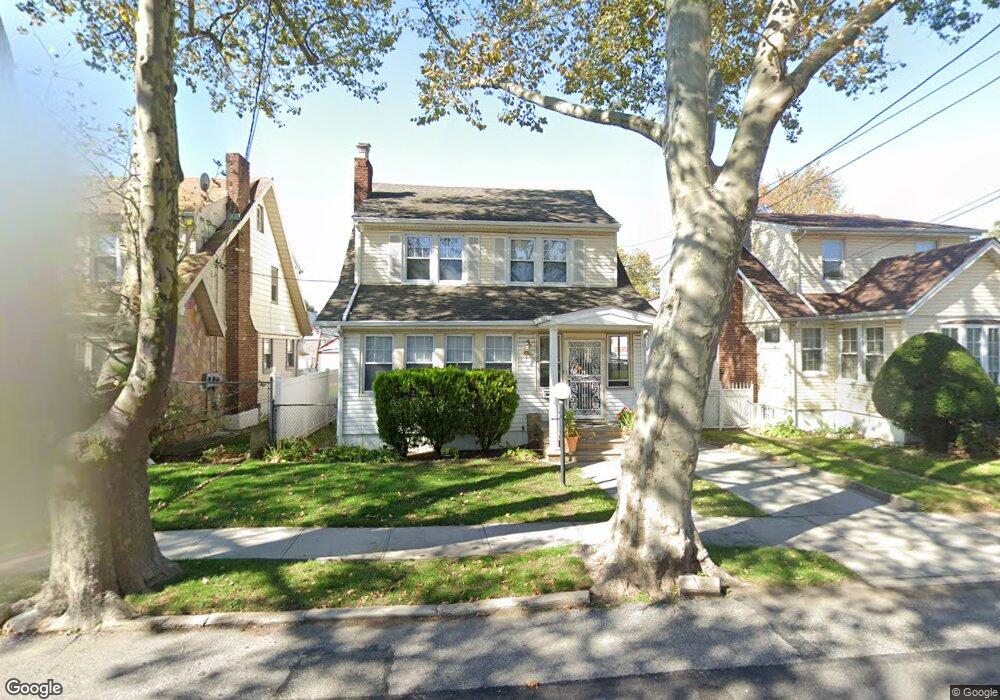
18523 Galway Ave Saint Albans, NY 11412
Hollis NeighborhoodEstimated Value: $611,210 - $836,000
--
Bed
--
Bath
1,335
Sq Ft
$537/Sq Ft
Est. Value
About This Home
This home is located at 18523 Galway Ave, Saint Albans, NY 11412 and is currently estimated at $716,303, approximately $536 per square foot. 18523 Galway Ave is a home located in Queens County with nearby schools including P.S. 118 Lorraine Hansberry, I.S. 192 The Linden, and Riverton Street Charter School.
Ownership History
Date
Name
Owned For
Owner Type
Purchase Details
Closed on
Nov 15, 1985
Sold by
Jones Helen and Jones Wilbur A
Bought by
Mcfarlane Loretta and Mc Farlane Reginald
Current Estimated Value
Create a Home Valuation Report for This Property
The Home Valuation Report is an in-depth analysis detailing your home's value as well as a comparison with similar homes in the area
Home Values in the Area
Average Home Value in this Area
Purchase History
| Date | Buyer | Sale Price | Title Company |
|---|---|---|---|
| Mcfarlane Loretta | -- | -- |
Source: Public Records
Tax History Compared to Growth
Tax History
| Year | Tax Paid | Tax Assessment Tax Assessment Total Assessment is a certain percentage of the fair market value that is determined by local assessors to be the total taxable value of land and additions on the property. | Land | Improvement |
|---|---|---|---|---|
| 2025 | $5,613 | $27,946 | $7,711 | $20,235 |
| 2024 | $3,765 | $27,946 | $7,247 | $20,699 |
| 2023 | $5,551 | $27,636 | $6,852 | $20,784 |
| 2022 | $5,296 | $36,480 | $10,860 | $25,620 |
| 2021 | $5,195 | $35,580 | $10,860 | $24,720 |
| 2020 | $4,633 | $31,260 | $10,860 | $20,400 |
| 2019 | $4,579 | $30,180 | $10,860 | $19,320 |
| 2018 | $4,397 | $23,030 | $8,648 | $14,382 |
| 2017 | $4,130 | $21,730 | $9,882 | $11,848 |
| 2016 | $3,802 | $21,730 | $9,882 | $11,848 |
| 2015 | $2,253 | $19,407 | $9,468 | $9,939 |
| 2014 | $2,253 | $19,407 | $11,373 | $8,034 |
Source: Public Records
Map
Nearby Homes
- 183-34 Fonda Ave
- 183-29 Brinkerhoff Ave
- 183-12 Elmira Ave
- 186-16 Hilburn Ave
- 183-09 Dunlop Ave
- 183-67 Dunlop Ave
- 187-23 Brinkerhoff Ave
- 187-44 Jordan Ave
- 188-31 Jordan Ave
- 18823 Mangin Ave
- 188-07 Mangin Ave
- 188-25 Mangin Ave
- 11176 180th St
- 111-06 Farmers Blvd
- 18833 Keeseville Ave
- 10533 Farmers Blvd
- 104-11 188th St
- 19027 109th Rd
- 19022 111th Rd
- 111-54 178th Place
- 18515 Galway Ave
- 18525 Galway Ave
- 18507 Galway Ave
- 18507 Galway Ave
- 18529 Galway Ave
- 18518 Fonda Ave
- 18514 Fonda Ave
- 18522 Fonda Ave
- 18510 Fonda Ave
- 185-01 Galway Ave
- 18501 Galway Ave
- 18526 Fonda Ave
- 18533 Galway Ave
- 18506 Fonda Ave
- 185-06 Fonda Ave
- 18516 Galway Ave
- 18520 Galway Ave
- 18530 Fonda Ave
- 18524 Galway Ave
- 18508 Galway Ave