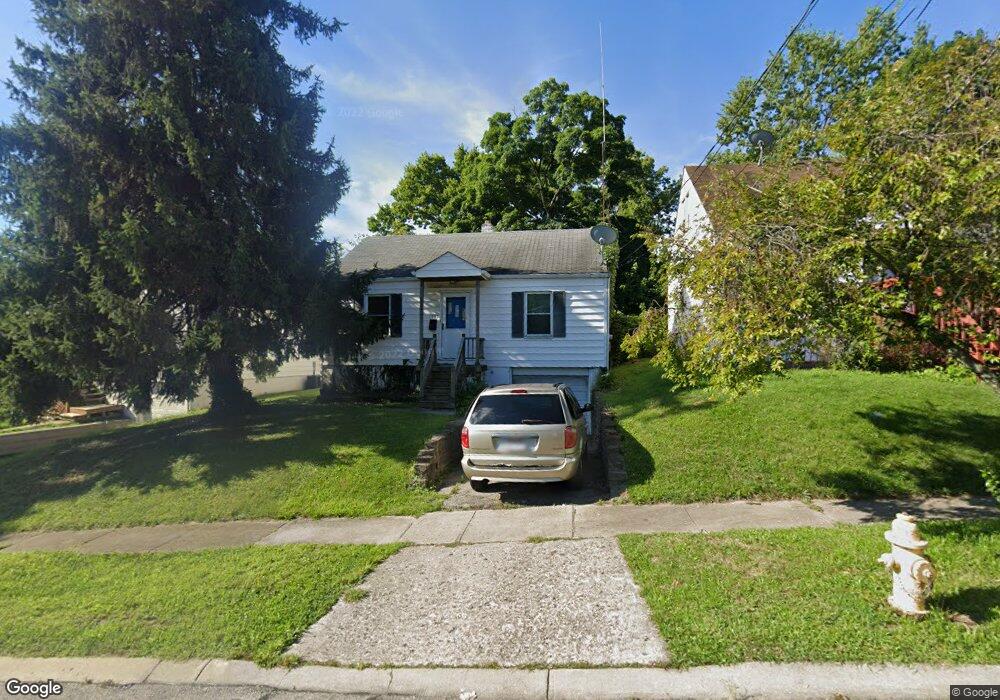
1853 Ashbrook Dr Cincinnati, OH 45238
West Price Hill NeighborhoodEstimated Value: $114,000 - $135,000
2
Beds
1
Bath
750
Sq Ft
$169/Sq Ft
Est. Value
About This Home
This home is located at 1853 Ashbrook Dr, Cincinnati, OH 45238 and is currently estimated at $126,394, approximately $168 per square foot. 1853 Ashbrook Dr is a home located in Hamilton County with nearby schools including Covedale School, Gilbert A. Dater High School, and Western Hills High School.
Ownership History
Date
Name
Owned For
Owner Type
Purchase Details
Closed on
Jul 28, 2025
Sold by
Kaanapali Renovations Llc
Bought by
1766 Ashbrook Llc
Current Estimated Value
Purchase Details
Closed on
Jul 25, 2025
Sold by
Foley Timothy Lee and Foley Billy
Bought by
Kaanapali Renovations Llc
Purchase Details
Closed on
Jun 19, 1998
Sold by
Koch Thomas and Koch Judith K
Bought by
Foley Timothy L
Home Financials for this Owner
Home Financials are based on the most recent Mortgage that was taken out on this home.
Original Mortgage
$61,145
Interest Rate
7.27%
Mortgage Type
FHA
Purchase Details
Closed on
Dec 17, 1997
Sold by
Davis Bonnie F
Bought by
Koch Thomas and Koch Judith K
Create a Home Valuation Report for This Property
The Home Valuation Report is an in-depth analysis detailing your home's value as well as a comparison with similar homes in the area
Home Values in the Area
Average Home Value in this Area
Purchase History
| Date | Buyer | Sale Price | Title Company |
|---|---|---|---|
| 1766 Ashbrook Llc | $50,000 | None Listed On Document | |
| 1766 Ashbrook Llc | $50,000 | None Listed On Document | |
| Kaanapali Renovations Llc | $45,000 | None Listed On Document | |
| Kaanapali Renovations Llc | $45,000 | None Listed On Document | |
| Foley Timothy L | $60,800 | Vintage Title Agency Inc | |
| Koch Thomas | $45,000 | -- |
Source: Public Records
Mortgage History
| Date | Status | Borrower | Loan Amount |
|---|---|---|---|
| Previous Owner | Foley Timothy L | $61,145 |
Source: Public Records
Tax History Compared to Growth
Tax History
| Year | Tax Paid | Tax Assessment Tax Assessment Total Assessment is a certain percentage of the fair market value that is determined by local assessors to be the total taxable value of land and additions on the property. | Land | Improvement |
|---|---|---|---|---|
| 2024 | $1,467 | $24,409 | $4,298 | $20,111 |
| 2023 | $1,500 | $24,409 | $4,298 | $20,111 |
| 2022 | $1,112 | $16,177 | $4,270 | $11,907 |
| 2021 | $1,067 | $16,177 | $4,270 | $11,907 |
| 2020 | $1,098 | $16,177 | $4,270 | $11,907 |
| 2019 | $1,091 | $14,708 | $3,882 | $10,826 |
| 2018 | $1,093 | $14,708 | $3,882 | $10,826 |
| 2017 | $1,038 | $14,708 | $3,882 | $10,826 |
| 2016 | $1,325 | $18,550 | $4,144 | $14,406 |
| 2015 | $1,195 | $18,550 | $4,144 | $14,406 |
| 2014 | $1,204 | $18,550 | $4,144 | $14,406 |
| 2013 | $1,390 | $21,081 | $4,711 | $16,370 |
Source: Public Records
Map
Nearby Homes
- 1861 Ashbrook Dr
- 1803 Ashbrook Dr
- 1869 Ashbrook Dr
- 1774 Ashbrook Dr
- 4769 Hardwick Dr
- 4764 Clevesdale Dr
- 4798 Prosperity Place
- 4826 Prosperity Place
- 4885 N Overlook Ave
- 4965 Glenway Ave
- 4910 Ferguson Place
- 4925 Shirley Place
- 4934 Relleum Ave
- 5020 Sidney Rd
- 5027 Sidney Rd
- 2957 Veazey Ave
- 4638 Glenway Ave
- 1131 Olivia Ln
- 4975 Heuwerth Ave
- 3032 S Hegry Cir
- 1857 Ashbrook Dr
- 1837 Ashbrook Dr
- 1829 Ashbrook Dr
- 1865 Ashbrook Dr
- 4700 Green Glen Ln
- 1821 Ashbrook Dr
- 4704 Green Glen Ln
- 1811 Ashbrook Dr
- 4708 Green Glen Ln
- 1846 Ashbrook Dr
- 1858 Ashbrook Dr
- 1862 Ashbrook Dr
- 1873 Ashbrook Dr
- 1842 Ashbrook Dr
- 4716 Green Glen Ln
- 1838 Ashbrook Dr
- 1866 Ashbrook Dr
- 1834 Ashbrook Dr
- 4720 Green Glen Ln
- 1877 Ashbrook Dr