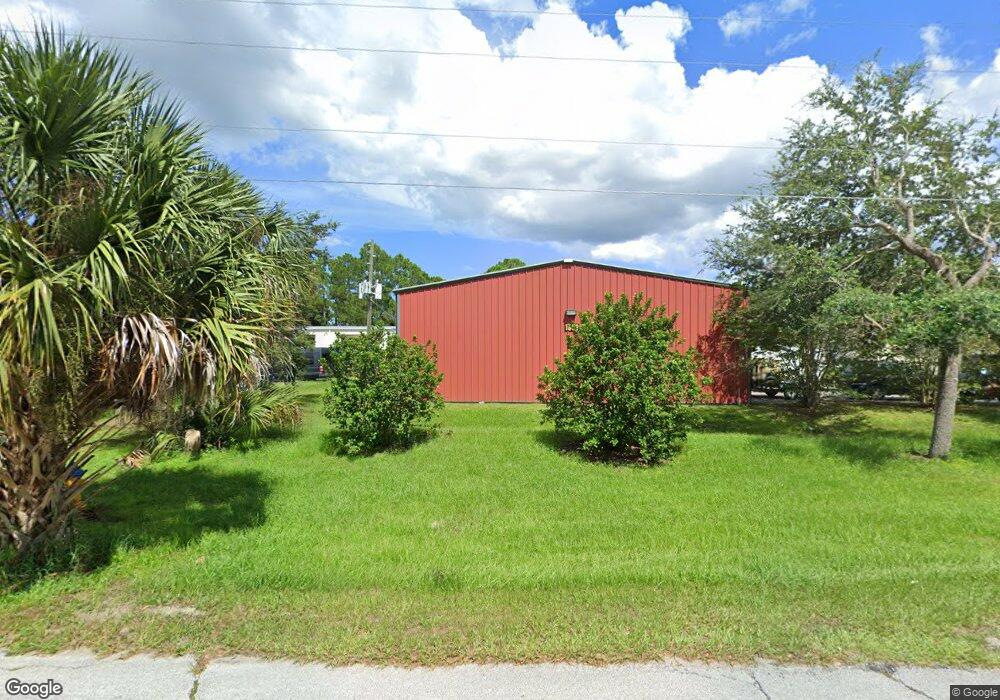
1853 Patterson Ave Deland, FL 32724
North DeLand NeighborhoodEstimated Value: $899,676
--
Bed
4
Baths
7,500
Sq Ft
$120/Sq Ft
Est. Value
About This Home
This home is located at 1853 Patterson Ave, Deland, FL 32724 and is currently estimated at $899,676, approximately $119 per square foot. 1853 Patterson Ave is a home located in Volusia County with nearby schools including George W. Marks Elementary School, Deland High School, and Deland Middle School.
Ownership History
Date
Name
Owned For
Owner Type
Purchase Details
Closed on
Aug 6, 2013
Sold by
Meyer Partners Llc
Bought by
Real Gold Inc
Current Estimated Value
Purchase Details
Closed on
Nov 10, 2008
Sold by
Buckner Properties Inc
Bought by
Meyer Partners Llc
Home Financials for this Owner
Home Financials are based on the most recent Mortgage that was taken out on this home.
Original Mortgage
$312,000
Interest Rate
6.11%
Mortgage Type
Commercial
Purchase Details
Closed on
May 19, 2005
Sold by
Patterson James A
Bought by
Buckner Properties Inc
Home Financials for this Owner
Home Financials are based on the most recent Mortgage that was taken out on this home.
Original Mortgage
$200,000
Interest Rate
5.74%
Mortgage Type
Commercial
Purchase Details
Closed on
Nov 14, 2001
Sold by
Perkinelmer Inc
Bought by
Burns Prop L L C
Home Financials for this Owner
Home Financials are based on the most recent Mortgage that was taken out on this home.
Original Mortgage
$1,455,000
Interest Rate
6.54%
Create a Home Valuation Report for This Property
The Home Valuation Report is an in-depth analysis detailing your home's value as well as a comparison with similar homes in the area
Home Values in the Area
Average Home Value in this Area
Purchase History
| Date | Buyer | Sale Price | Title Company |
|---|---|---|---|
| Real Gold Inc | $340,000 | Equitable Title Of Seminole | |
| Meyer Partners Llc | $390,000 | Dba Volusia Title Services | |
| Buckner Properties Inc | $110,000 | Coast Title Of Volusia Inc | |
| Burns Prop L L C | $1,620,000 | -- |
Source: Public Records
Mortgage History
| Date | Status | Borrower | Loan Amount |
|---|---|---|---|
| Previous Owner | Meyer Partners Llc | $312,000 | |
| Previous Owner | Buckner Properties Inc | $200,000 | |
| Previous Owner | Burns Prop L L C | $1,455,000 |
Source: Public Records
Tax History Compared to Growth
Tax History
| Year | Tax Paid | Tax Assessment Tax Assessment Total Assessment is a certain percentage of the fair market value that is determined by local assessors to be the total taxable value of land and additions on the property. | Land | Improvement |
|---|---|---|---|---|
| 2025 | $7,879 | $474,916 | $78,494 | $396,422 |
| 2024 | $7,879 | $468,330 | $78,494 | $389,836 |
| 2023 | $7,879 | $420,154 | $68,682 | $351,472 |
| 2022 | $7,332 | $386,820 | $68,682 | $318,138 |
| 2021 | $7,151 | $348,117 | $58,871 | $289,246 |
| 2020 | $7,272 | $352,909 | $58,871 | $294,038 |
| 2019 | $7,048 | $326,453 | $58,871 | $267,582 |
| 2018 | $7,003 | $311,112 | $65,797 | $245,315 |
| 2017 | $7,151 | $306,652 | $57,716 | $248,936 |
| 2016 | $6,684 | $291,022 | $0 | $0 |
| 2015 | $6,661 | $280,773 | $0 | $0 |
| 2014 | $6,776 | $279,070 | $0 | $0 |
Source: Public Records
Map
Nearby Homes
- 1601 N Woodland Blvd
- 0 Newport Ave
- 260 Mercers Fernery Rd
- 2401 N Woodland Blvd
- 124 Lake Molly Ave
- 195 Lake Molly Ave
- 2200 N Clara Ave
- 305 Violetwood Rd
- 7 Valencia Ct
- 4 Navel Ct
- 1 Smith Ct
- 516 Grace Ave
- 425 Mercers Fernery Rd
- 104 E Rosehill Ave
- 1412 N Garfield Ave
- 0 North St Unit 1211817
- 0 North St Unit 1216611
- 0 No St Unit MFRV4933386
- 0 No St Unit MFRO6357154
- 0 No St Unit MFRV4941771
- 1855 Patterson Ave
- 0 Bennett Dr Unit V4717579
- 1857 Patterson Ave Unit 2-3
- 1857 Patterson Ave Unit 1
- 1857 Patterson Ave
- 1857 Patterson Ave Unit 6
- 0 Hamilton Rd Unit V4703920
- 0 Bennett Dr Unit V4717620
- 1815 Patterson Ave
- 1856 Patterson Ave
- 236 Tupelo Honey Cir
- 232 Tupelo Honey Cir
- 228 Tupelo Honey Cir
- 224 Tupelo Honey Cir
- 220 Tupelo Honey Cir
- 1813 Patterson Ave
- 240 Tupelo Honey Cir
- 216 Tupelo Honey Cir
- 212 Tupelo Honey Cir
- 1802 Palmetto Rd