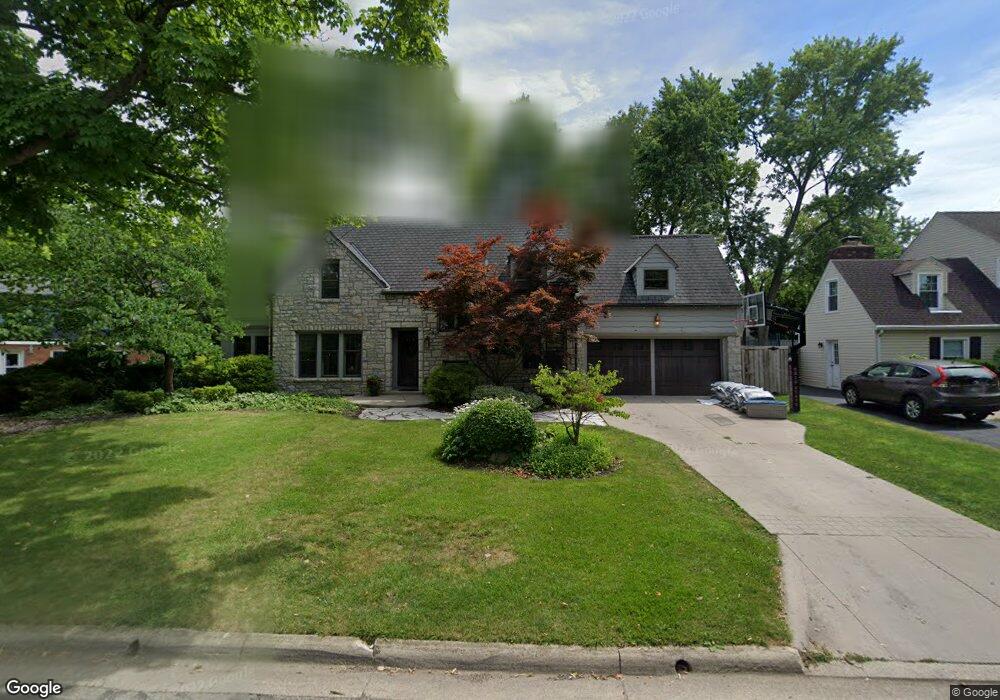
1855 Chatfield Rd Columbus, OH 43221
Estimated Value: $916,659 - $1,094,000
5
Beds
3
Baths
2,635
Sq Ft
$383/Sq Ft
Est. Value
About This Home
This home is located at 1855 Chatfield Rd, Columbus, OH 43221 and is currently estimated at $1,008,415, approximately $382 per square foot. 1855 Chatfield Rd is a home located in Franklin County with nearby schools including Barrington Road Elementary School, Jones Middle School, and Upper Arlington High School.
Ownership History
Date
Name
Owned For
Owner Type
Purchase Details
Closed on
Jul 17, 2008
Sold by
Diwik Jason C and Diwik Caroline E
Bought by
Diwik Caroline E
Current Estimated Value
Home Financials for this Owner
Home Financials are based on the most recent Mortgage that was taken out on this home.
Original Mortgage
$412,000
Interest Rate
6.15%
Mortgage Type
Purchase Money Mortgage
Purchase Details
Closed on
Feb 3, 2006
Sold by
Grosskinsky Clemens M and Wells Eileen
Bought by
Wells Eileen
Purchase Details
Closed on
Nov 7, 2000
Sold by
Wells Grosskinsky Clemens M and Wells Eileen
Bought by
Grosskinsky Clemens M and Wells Eileen
Purchase Details
Closed on
May 16, 1994
Bought by
Grosskinsky Clemens M
Purchase Details
Closed on
Apr 1, 1986
Purchase Details
Closed on
Apr 1, 1979
Create a Home Valuation Report for This Property
The Home Valuation Report is an in-depth analysis detailing your home's value as well as a comparison with similar homes in the area
Home Values in the Area
Average Home Value in this Area
Purchase History
| Date | Buyer | Sale Price | Title Company |
|---|---|---|---|
| Diwik Caroline E | -- | Title First | |
| Diwik Jason C | $515,000 | Title First | |
| Wells Eileen | -- | None Available | |
| Grosskinsky Clemens M | -- | -- | |
| Grosskinsky Clemens M | $240,000 | -- | |
| -- | $105,000 | -- | |
| -- | $122,500 | -- |
Source: Public Records
Mortgage History
| Date | Status | Borrower | Loan Amount |
|---|---|---|---|
| Previous Owner | Diwik Jason C | $412,000 |
Source: Public Records
Tax History Compared to Growth
Tax History
| Year | Tax Paid | Tax Assessment Tax Assessment Total Assessment is a certain percentage of the fair market value that is determined by local assessors to be the total taxable value of land and additions on the property. | Land | Improvement |
|---|---|---|---|---|
| 2024 | $15,148 | $261,660 | $108,850 | $152,810 |
| 2023 | $14,960 | $261,660 | $108,850 | $152,810 |
| 2022 | $15,188 | $217,140 | $73,080 | $144,060 |
| 2021 | $13,432 | $217,140 | $73,080 | $144,060 |
| 2020 | $13,313 | $217,140 | $73,080 | $144,060 |
| 2019 | $13,381 | $192,960 | $73,080 | $119,880 |
| 2018 | $12,718 | $192,960 | $73,080 | $119,880 |
| 2017 | $13,377 | $192,960 | $73,080 | $119,880 |
| 2016 | $12,142 | $182,140 | $61,810 | $120,330 |
| 2015 | $12,132 | $182,140 | $61,810 | $120,330 |
| 2014 | $12,046 | $182,140 | $61,810 | $120,330 |
| 2013 | $5,801 | $165,550 | $56,175 | $109,375 |
Source: Public Records
Map
Nearby Homes
- 2276 Northwest Blvd
- 1932 Suffolk Rd Unit 1932
- 2063 Westover Rd
- 2569 Chester Rd
- 2615 Northwest Blvd
- 2110 Northwest Blvd
- 1565 Berkshire Rd
- 2585 Westmont Blvd
- 1535 Doone Rd
- 2593 Coventry Rd
- 2648 Chester Rd
- 1550 College Hill Dr
- 1470 Cardiff Rd
- 1481 Doone Rd
- 1488 Essex Rd
- 1934 Bedford Rd
- 2295 Oxford Rd
- 1659 Tremont Rd
- 2027-2033 Ridgeview Rd
- 1733 Elmwood Ave
- 1865 Chatfield Rd
- 1850 Tewksbury Rd
- 1840 Tewksbury Rd
- 1860 Tewksbury Rd
- 1873 Chatfield Rd
- 1850 Chatfield Rd
- 1858 Chatfield Rd
- 1870 Tewksbury Rd
- 1866 Chatfield Rd
- 1844 Chatfield Rd
- 1879 Chatfield Rd
- 1874 Chatfield Rd
- 1830 Chatfield Rd
- 1835 Tewksbury Rd
- 1845 Tewksbury Rd
- 1853 Tewksbury Rd
- 1880 Tewksbury Rd
- 1880 Chatfield Rd
- 2336 Andover Rd
- 2350 Andover Rd