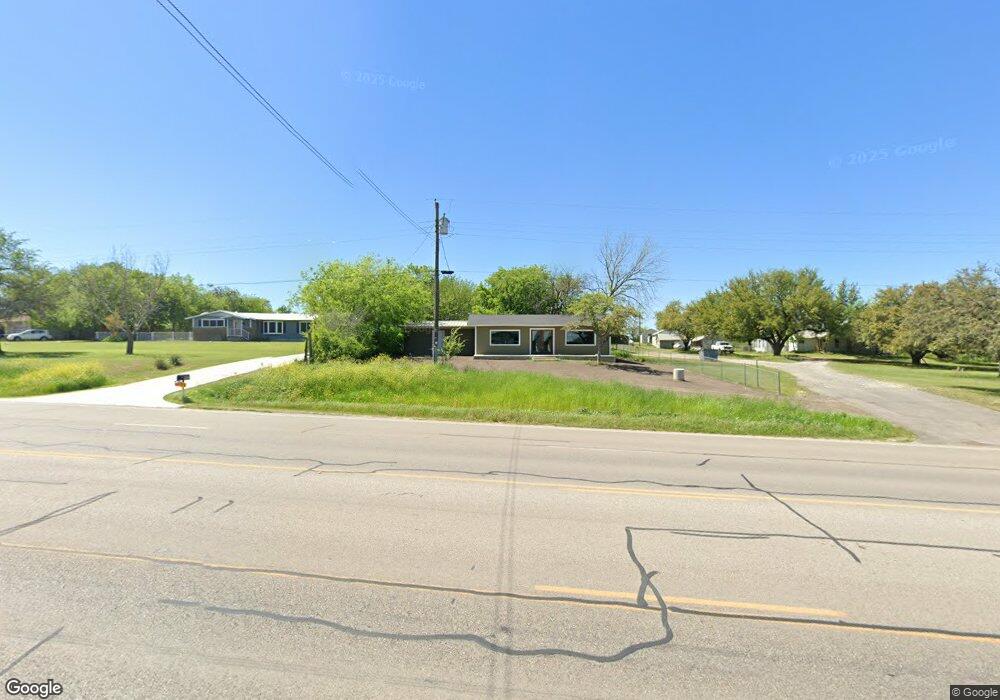
1855 N Main St Weatherford, TX 76085
Estimated Value: $227,329 - $402,000
--
Bed
--
Bath
1,560
Sq Ft
$211/Sq Ft
Est. Value
About This Home
This home is located at 1855 N Main St, Weatherford, TX 76085 and is currently estimated at $329,832, approximately $211 per square foot. 1855 N Main St is a home located in Parker County with nearby schools including Seguin Elementary School, Tison Middle School, and Weatherford High School.
Ownership History
Date
Name
Owned For
Owner Type
Purchase Details
Closed on
Dec 16, 2018
Sold by
Burleson Melissa Ann
Bought by
Mcdaniel James R
Current Estimated Value
Purchase Details
Closed on
Nov 13, 2010
Sold by
Burleson Danny Ray
Bought by
Davenport Melissa Ann
Purchase Details
Closed on
Jul 12, 1984
Bought by
Davenport Melissa Ann
Create a Home Valuation Report for This Property
The Home Valuation Report is an in-depth analysis detailing your home's value as well as a comparison with similar homes in the area
Home Values in the Area
Average Home Value in this Area
Purchase History
| Date | Buyer | Sale Price | Title Company |
|---|---|---|---|
| Mcdaniel James R | -- | None Available | |
| Davenport Melissa Ann | -- | -- | |
| Davenport Melissa Ann | -- | -- |
Source: Public Records
Tax History Compared to Growth
Tax History
| Year | Tax Paid | Tax Assessment Tax Assessment Total Assessment is a certain percentage of the fair market value that is determined by local assessors to be the total taxable value of land and additions on the property. | Land | Improvement |
|---|---|---|---|---|
| 2025 | $3,405 | $149,770 | $20,700 | $129,070 |
| 2024 | $3,405 | $209,020 | $75,000 | $134,020 |
| 2023 | $3,405 | $209,020 | $75,000 | $134,020 |
| 2022 | $1,568 | $84,220 | $35,000 | $49,220 |
| 2021 | $1,700 | $84,220 | $35,000 | $49,220 |
| 2020 | $1,326 | $65,380 | $30,000 | $35,380 |
| 2019 | $1,415 | $65,380 | $30,000 | $35,380 |
| 2018 | $710 | $32,660 | $5,400 | $27,260 |
| 2017 | $725 | $32,660 | $5,400 | $27,260 |
| 2016 | $699 | $31,500 | $5,400 | $26,100 |
| 2015 | $320 | $31,500 | $5,400 | $26,100 |
| 2014 | $385 | $29,380 | $4,680 | $24,700 |
Source: Public Records
Map
Nearby Homes
- 1835 N Main St
- 1829 N Main St
- 109 Odel Dr
- 1813 Roadrunner Dr
- 125 Odel Dr
- 1727 N Main St
- 1713 N Main St
- 1712 Madison St
- 305-B E 8th St
- 1613 Franklin St
- 2000 Vanderbilt Dr
- 305 E 8th St
- 201 E 7th St
- 116 W 7th St
- 2358 Tanglewood St
- 203 E 7th St
- 221 E 7th St
- Lot 11 Pepperdine Dr
- Lot 12 Pepperdine Dr
- Lot 10 Pepperdine Dr
- 1857 N Main St
- 1853 N Main St
- 1863 N Main St
- 1884 Pheasant Dr
- 1880 Pheasant Dr
- 1876 Pheasant Dr
- 1851 N Main St
- 1872 Pheasant Dr
- 1875 Pheasant Dr
- 000 N Fm 51
- 1868 Pheasant Dr
- 1900 Farm To Market 51
- 1864 Pheasant Dr
- 1904 N Main St
- 1874 Sandpiper Dr
- 1870 Sandpiper Dr
- 1866 Sandpiper Dr
- 1917 N Highway 51
- 1862 Sandpiper Dr
- 1860 Pheasant Dr