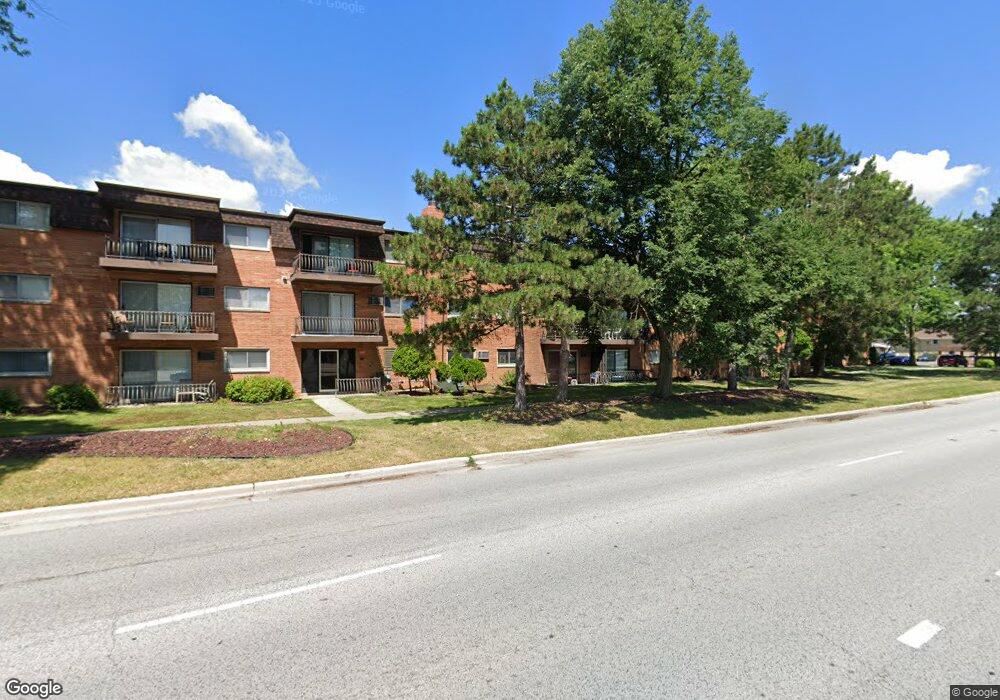
18550 Torrence Ave Unit 115 Lansing, IL 60438
Estimated Value: $69,309 - $92,000
2
Beds
1
Bath
800
Sq Ft
$105/Sq Ft
Est. Value
About This Home
This home is located at 18550 Torrence Ave Unit 115, Lansing, IL 60438 and is currently estimated at $83,827, approximately $104 per square foot. 18550 Torrence Ave Unit 115 is a home located in Cook County with nearby schools including Oak Glen Elementary School, Memorial Jr High School, and Thornton Fractnl So High School.
Ownership History
Date
Name
Owned For
Owner Type
Purchase Details
Closed on
Oct 24, 2013
Sold by
Watson Camille
Bought by
Canty Mable and Johnson Vonzel
Current Estimated Value
Purchase Details
Closed on
Sep 18, 2006
Sold by
Rosas Jaime and Rosas Caroline
Bought by
Shoemate Jacqueline
Purchase Details
Closed on
Apr 10, 2006
Sold by
Bohacik Jacque D
Bought by
Watson Camille
Home Financials for this Owner
Home Financials are based on the most recent Mortgage that was taken out on this home.
Original Mortgage
$83,000
Interest Rate
6.48%
Mortgage Type
Fannie Mae Freddie Mac
Purchase Details
Closed on
Feb 26, 1998
Sold by
Sorrentino Patricia A
Bought by
Bohacik Jacque D
Purchase Details
Closed on
Dec 16, 1994
Sold by
Columbia National Bank Of Chicago
Bought by
Sorrentino Patricia A
Home Financials for this Owner
Home Financials are based on the most recent Mortgage that was taken out on this home.
Original Mortgage
$63,300
Interest Rate
9.19%
Mortgage Type
FHA
Create a Home Valuation Report for This Property
The Home Valuation Report is an in-depth analysis detailing your home's value as well as a comparison with similar homes in the area
Home Values in the Area
Average Home Value in this Area
Purchase History
| Date | Buyer | Sale Price | Title Company |
|---|---|---|---|
| Canty Mable | $14,500 | None Available | |
| Shoemate Jacqueline | $63,000 | Multiple | |
| Watson Camille | $83,000 | Attorneys Title Guaranty Fun | |
| Bohacik Jacque D | $72,000 | -- | |
| Sorrentino Patricia A | $65,000 | -- |
Source: Public Records
Mortgage History
| Date | Status | Borrower | Loan Amount |
|---|---|---|---|
| Previous Owner | Watson Camille | $83,000 | |
| Previous Owner | Sorrentino Patricia A | $63,300 |
Source: Public Records
Tax History
| Year | Tax Paid | Tax Assessment Tax Assessment Total Assessment is a certain percentage of the fair market value that is determined by local assessors to be the total taxable value of land and additions on the property. | Land | Improvement |
|---|---|---|---|---|
| 2025 | $1,662 | $6,750 | $1,041 | $5,709 |
| 2024 | $1,662 | $6,750 | $1,041 | $5,709 |
| 2023 | $683 | $6,750 | $1,041 | $5,709 |
| 2022 | $683 | $4,473 | $947 | $3,526 |
| 2021 | $721 | $4,471 | $946 | $3,525 |
| 2020 | $803 | $4,471 | $946 | $3,525 |
| 2019 | $0 | $2,760 | $851 | $1,909 |
| 2018 | $0 | $2,761 | $851 | $1,910 |
| 2017 | $1,558 | $2,761 | $851 | $1,910 |
| 2016 | $778 | $3,920 | $757 | $3,163 |
| 2015 | $764 | $4,127 | $757 | $3,370 |
| 2014 | $2,068 | $4,127 | $757 | $3,370 |
| 2013 | $1,394 | $4,946 | $757 | $4,189 |
Source: Public Records
Map
Nearby Homes
- 2340 186th St Unit 7
- 18550 Torrence Ave Unit 19
- 18550 Torrence Ave Unit 5
- 18446 Glen Oak Ave
- 18439 Locust St
- 18340 Glen Oak Ave Unit 1D
- 18340 Glen Oak Ave Unit 3C
- 18331 Hickory St
- 18555 Olde Farm Rd
- 18559 Escanaba Ave Unit 201
- 18559 Escanaba Ave Unit 305
- 18309 Bock Rd
- 18235 Exchange Ave
- 2810 186th St
- 2621 Ridge Rd
- 2643 Ridge Rd
- 2616 Ridge Rd
- 18539 Country Ln
- 18655 Oakwood Ave
- 2715 Indiana Ave
- 18550 Torrence Ave Unit 2
- 18550 Torrence Ave Unit 1
- 18550 Torrence Ave Unit 116
- 18550 Torrence Ave Unit 117
- 18550 Torrence Ave Unit 11
- 18550 Torrence Ave Unit 126
- 18550 Torrence Ave Unit 123
- 18550 Torrence Ave Unit 112
- 18550 Torrence Ave Unit 418
- 18550 Torrence Ave Unit 16
- 18550 Torrence Ave Unit 15
- 18550 Torrence Ave Unit 14
- 18550 Torrence Ave Unit 111
- 18550 Torrence Ave Unit 124
- 18550 Torrence Ave Unit 125
- 18550 Torrence Ave Unit 114
- 18550 Torrence Ave Unit 127
- 18550 Torrence Ave Unit 17
- 18550 Torrence Ave Unit 110
- 18550 Torrence Ave Unit 12
Your Personal Tour Guide
Ask me questions while you tour the home.