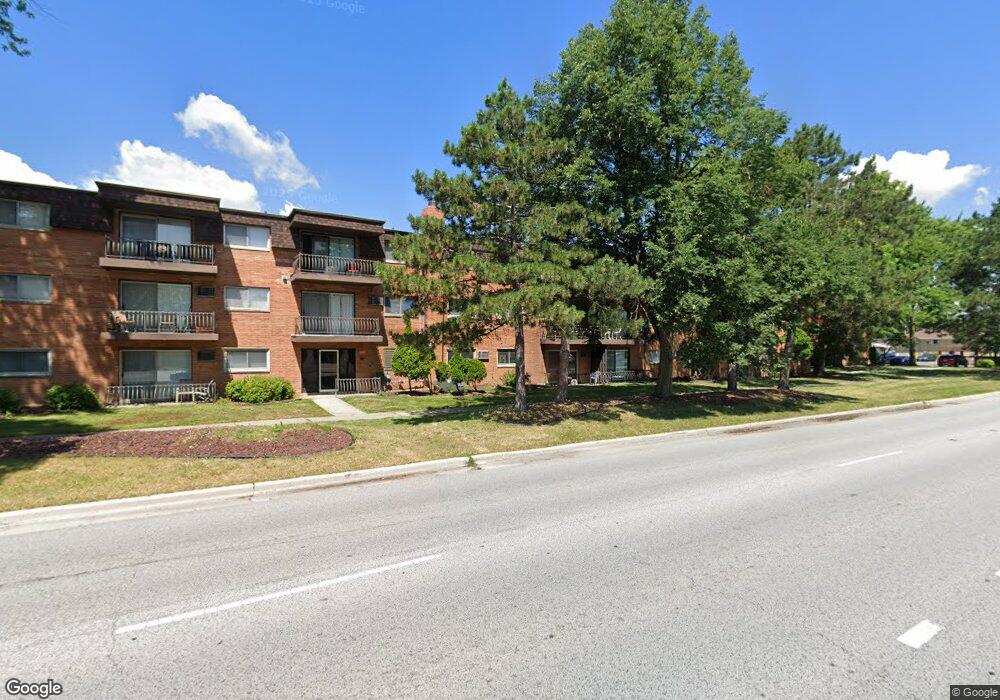
18550 Torrence Ave Unit 128 Lansing, IL 60438
Estimated Value: $79,000 - $103,000
2
Beds
1
Bath
851
Sq Ft
$103/Sq Ft
Est. Value
About This Home
This home is located at 18550 Torrence Ave Unit 128, Lansing, IL 60438 and is currently estimated at $87,514, approximately $102 per square foot. 18550 Torrence Ave Unit 128 is a home located in Cook County with nearby schools including Oak Glen Elementary School, Memorial Jr High School, and Thornton Fractnl So High School.
Ownership History
Date
Name
Owned For
Owner Type
Purchase Details
Closed on
May 10, 2023
Sold by
Johnson Kenya M
Bought by
Sk Investment Properties Llc
Current Estimated Value
Purchase Details
Closed on
Nov 19, 2012
Sold by
Larkins Nelson D and Larkins Nelson
Bought by
The Secretary Of Hud
Purchase Details
Closed on
Apr 30, 2012
Sold by
The Secretary Of Hud
Bought by
Johnson Kenya M
Purchase Details
Closed on
Aug 11, 2004
Sold by
Pope Suzanne M
Bought by
Larkins Nelson Devon
Home Financials for this Owner
Home Financials are based on the most recent Mortgage that was taken out on this home.
Original Mortgage
$80,400
Interest Rate
6.08%
Mortgage Type
FHA
Purchase Details
Closed on
Oct 27, 1994
Sold by
South Holland Trust & Svgs Bank
Bought by
Pope Suzanne M
Home Financials for this Owner
Home Financials are based on the most recent Mortgage that was taken out on this home.
Original Mortgage
$60,800
Interest Rate
8.86%
Mortgage Type
FHA
Create a Home Valuation Report for This Property
The Home Valuation Report is an in-depth analysis detailing your home's value as well as a comparison with similar homes in the area
Home Values in the Area
Average Home Value in this Area
Purchase History
| Date | Buyer | Sale Price | Title Company |
|---|---|---|---|
| Sk Investment Properties Llc | $68,000 | Chicago Title | |
| The Secretary Of Hud | -- | None Available | |
| Johnson Kenya M | -- | None Available | |
| Larkins Nelson Devon | $83,000 | Pntn | |
| Pope Suzanne M | $62,400 | -- |
Source: Public Records
Mortgage History
| Date | Status | Borrower | Loan Amount |
|---|---|---|---|
| Previous Owner | Larkins Nelson Devon | $80,400 | |
| Previous Owner | Pope Suzanne M | $60,800 |
Source: Public Records
Tax History Compared to Growth
Tax History
| Year | Tax Paid | Tax Assessment Tax Assessment Total Assessment is a certain percentage of the fair market value that is determined by local assessors to be the total taxable value of land and additions on the property. | Land | Improvement |
|---|---|---|---|---|
| 2024 | $2,922 | $6,040 | $932 | $5,108 |
| 2023 | $2,600 | $6,040 | $932 | $5,108 |
| 2022 | $2,600 | $4,002 | $847 | $3,155 |
| 2021 | $2,529 | $4,000 | $846 | $3,154 |
| 2020 | $2,347 | $4,000 | $846 | $3,154 |
| 2019 | $1,406 | $2,470 | $762 | $1,708 |
| 2018 | $1,743 | $3,119 | $762 | $2,357 |
| 2017 | $1,760 | $3,119 | $762 | $2,357 |
| 2016 | $2,019 | $3,692 | $677 | $3,015 |
| 2015 | $1,876 | $3,692 | $677 | $3,015 |
| 2014 | $1,850 | $3,692 | $677 | $3,015 |
| 2013 | $1,612 | $3,580 | $677 | $2,903 |
Source: Public Records
Map
Nearby Homes
- 18550 Torrence Ave Unit 19
- 18550 Torrence Ave Unit 15
- 18518 Glen Oak Ave
- 18508 Torrence Ave
- 2345 185th Ct Unit 25
- 18429 Arcadia Ave
- 2444 187th St
- 18340 Glen Oak Ave Unit 1D
- 18340 Glen Oak Ave Unit 3C
- 2444 187th Place
- 18559 Escanaba Ave Unit 305
- 18307 Locust St
- 18309 Bock Rd
- 2290 182nd Place
- 18235 Exchange Ave
- 18443 De Jong Ln
- 2606 Ridge Rd
- 2643 Ridge Rd
- 2616 Ridge Rd
- 18452 Oakwood Ave
- 18550 Torrence Ave Unit 2
- 18550 Torrence Ave Unit 1
- 18550 Torrence Ave Unit 116
- 18550 Torrence Ave Unit 117
- 18550 Torrence Ave Unit 11
- 18550 Torrence Ave Unit 126
- 18550 Torrence Ave Unit 123
- 18550 Torrence Ave Unit 112
- 18550 Torrence Ave Unit 418
- 18550 Torrence Ave Unit 16
- 18550 Torrence Ave Unit 14
- 18550 Torrence Ave Unit 115
- 18550 Torrence Ave Unit 111
- 18550 Torrence Ave Unit 124
- 18550 Torrence Ave Unit 125
- 18550 Torrence Ave Unit 114
- 18550 Torrence Ave Unit 127
- 18550 Torrence Ave Unit 17
- 18550 Torrence Ave Unit 110
- 18550 Torrence Ave Unit 12