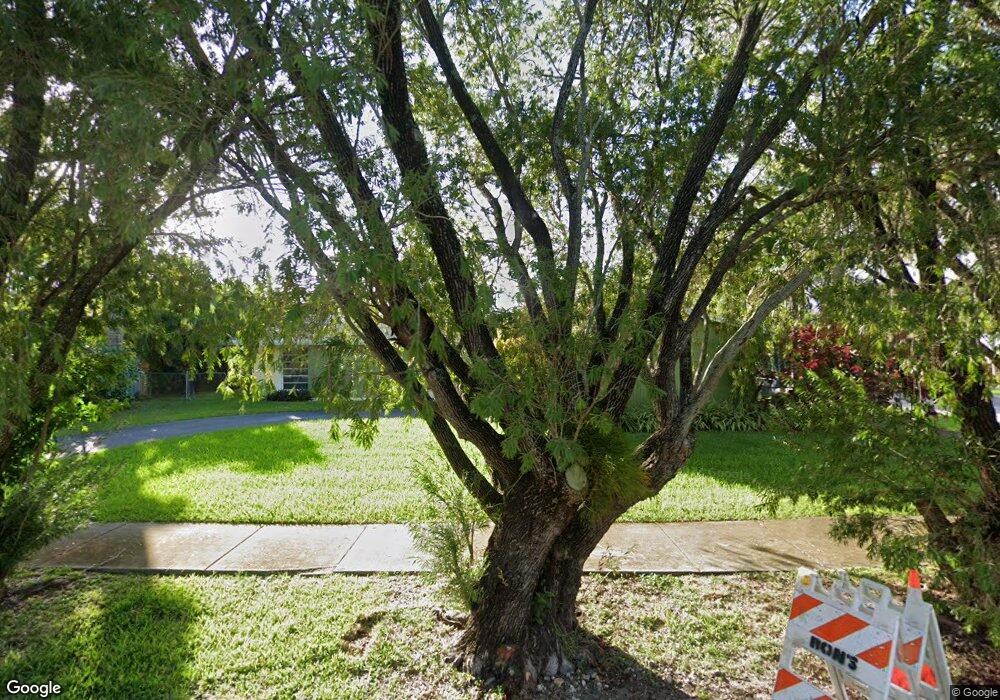
18556 SW 93rd Place Cutler Bay, FL 33157
Estimated Value: $626,888 - $818,000
About This Home
MUST CALL TO SEE OR DISCUSS. NO INDOOR ANIMALS. Beautiful Bright Open Tiffany model LARGE 3/2 home for rent. Large Living Room with separate formal dining area that leads on to screened patio. Big modern open kitchen. Laundry room off kitchen in garage. This home has a large oversized corner fenced yard on HUGE cul-de-sac of homes & provides a safe environment for children to play. The large screened enclosed patio on back gives way to ideal family-friend celebrations. Best neighborhood in Cutler Bay. Easy access to all major highways makes this location ideal no matter where your business location might take you.
Known as a quiet safe neighborhood of homeowners with excellent local schools both public & parochial. New roof completed in 2019 ; Silver Dimensional 40 year shingle. New central A/C unit 2018.
Cutler Bay is a vibrant community of almost 40, 000 residents who enjoy its beauty & natural surroundings. The town boundaries are as follows: On the North or 2 short blocks is SW 184 St. (Eureka Drive) which borders Palmetto Bay, on the East it goes to Biscayne Bay National Park; on the West to US1 only. It forms a town of approximately 10 Sq. Miles.
One indoor cat considered. Full background, credit & previous eviction check done on all applicants. Please contact owner DIRECTLY to discuss.
Home Values in the Area
Average Home Value in this Area
Property History
| Date | Event | Price | List to Sale | Price per Sq Ft |
|---|---|---|---|---|
| 11/11/2024 11/11/24 | Off Market | $3,500 | -- | -- |
| 10/08/2024 10/08/24 | Off Market | $3,500 | -- | -- |
| 09/28/2024 09/28/24 | For Rent | $3,500 | 0.0% | -- |
| 06/17/2024 06/17/24 | For Rent | $3,500 | +9.4% | -- |
| 06/07/2022 06/07/22 | For Rent | $3,200 | 0.0% | -- |
| 05/18/2022 05/18/22 | For Rent | $3,200 | -- | -- |
Tax History Compared to Growth
Tax History
| Year | Tax Paid | Tax Assessment Tax Assessment Total Assessment is a certain percentage of the fair market value that is determined by local assessors to be the total taxable value of land and additions on the property. | Land | Improvement |
|---|---|---|---|---|
| 2025 | $8,682 | $444,679 | -- | -- |
| 2024 | $7,885 | $404,254 | -- | -- |
| 2023 | $7,885 | $367,504 | $0 | $0 |
| 2022 | $7,020 | $334,095 | $0 | $0 |
| 2021 | $6,106 | $303,723 | $148,632 | $155,091 |
| 2020 | $5,830 | $291,352 | $135,120 | $156,232 |
| 2019 | $5,525 | $285,510 | $127,050 | $158,460 |
| 2018 | $4,955 | $262,780 | $102,093 | $160,687 |
| 2017 | $4,661 | $224,176 | $0 | $0 |
| 2016 | $4,387 | $203,797 | $0 | $0 |
| 2015 | $4,064 | $185,270 | $0 | $0 |
| 2014 | -- | $168,428 | $0 | $0 |
Map
- 9371 SW 185th Terrace
- 9385 SW 185th St
- 9384 SW 184th Terrace
- 9250 SW 185th Terrace
- 18332 SW 94th Ct
- 9312 SW 182nd St
- 18211 SW 95th Ct
- 9230 SW 183rd Terrace
- 18525 SW 90th Ct
- 9435 SW 181st Terrace
- 9355 SW 181st St
- 9455 SW 181st St
- 9380 SW 179th Terrace
- 18231 SW 90th Ct
- 18730 SW 90th Ave
- 18601 SW 98th Ave
- 18941 SW 92nd Ct
- 18811 SW 97th Ave
- 18745 SW 99th Rd
- 9104 SW 180th St
- 18558 SW 93rd Place
- 18557 SW 93rd Place
- 18553 SW 93rd Place
- 18563 SW 93rd Place
- 18555 SW 94th Ave
- 18566 SW 93rd Place
- 18561 SW 94th Ave
- 9365 SW 185th Terrace
- 9385 SW 185th Terrace
- 9391 SW 185th Terrace
- 9377 Sterling Dr
- 9402 SW 185th Terrace
- 18581 SW 94th Ave
- 9380 SW 185th St
- 9373 Sterling Dr
- 9378 SW 185th St
- 9416 SW 185th Terrace
- 9401 SW 185th Terrace
- 9386 SW 185th St
