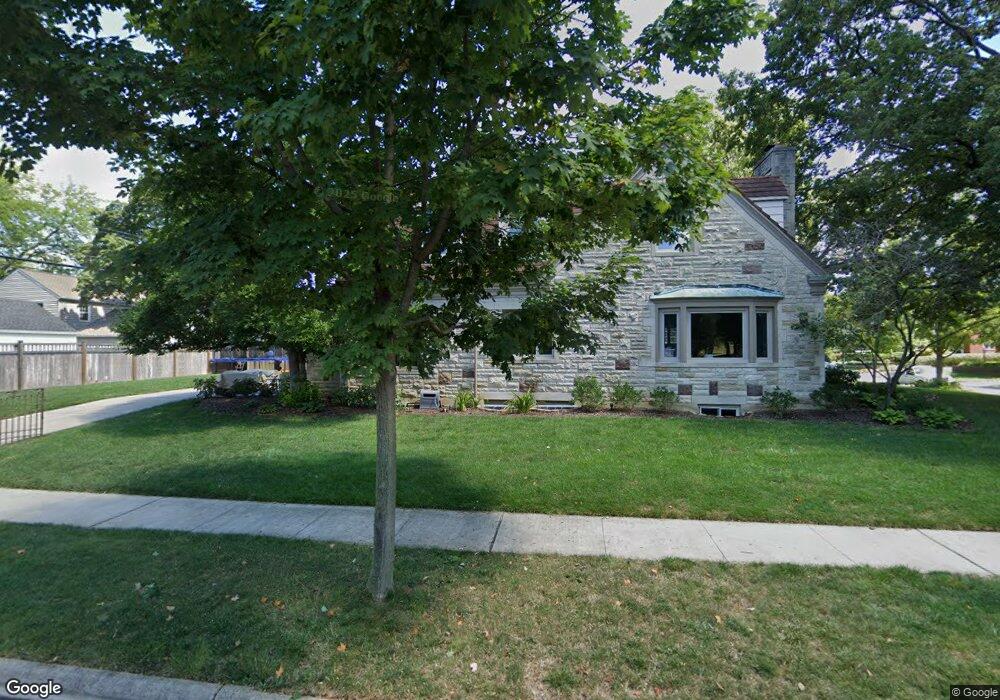
1856 Baldridge Rd Columbus, OH 43221
Estimated Value: $864,000 - $965,003
4
Beds
3
Baths
2,736
Sq Ft
$331/Sq Ft
Est. Value
About This Home
This home is located at 1856 Baldridge Rd, Columbus, OH 43221 and is currently estimated at $904,501, approximately $330 per square foot. 1856 Baldridge Rd is a home located in Franklin County with nearby schools including Barrington Road Elementary School, Jones Middle School, and Upper Arlington High School.
Ownership History
Date
Name
Owned For
Owner Type
Purchase Details
Closed on
Jul 26, 2021
Sold by
Pesavento Todd E and Cyran-Pesavento Katherine M
Bought by
Yeager James A and Yeager Katie E
Current Estimated Value
Home Financials for this Owner
Home Financials are based on the most recent Mortgage that was taken out on this home.
Original Mortgage
$548,250
Outstanding Balance
$492,583
Interest Rate
2.7%
Mortgage Type
New Conventional
Estimated Equity
$411,918
Purchase Details
Closed on
Jul 10, 1995
Sold by
Setterlin Bernice
Bought by
To Todd E Pesavento and To Kathryn Cyran Pe
Home Financials for this Owner
Home Financials are based on the most recent Mortgage that was taken out on this home.
Original Mortgage
$229,500
Interest Rate
7.25%
Mortgage Type
New Conventional
Create a Home Valuation Report for This Property
The Home Valuation Report is an in-depth analysis detailing your home's value as well as a comparison with similar homes in the area
Home Values in the Area
Average Home Value in this Area
Purchase History
We collect this data history from publicly available records. To have your information removed, we recommend requesting removal directly through your county’s website.
| Date | Buyer | Sale Price | Title Company |
|---|---|---|---|
| Yeager James A | $655,000 | New Title Company Name | |
| To Todd E Pesavento | $255,000 | -- |
Source: Public Records
Mortgage History
We collect this data history from publicly available records. To have your information removed, we recommend requesting removal directly through your county’s website.
| Date | Status | Borrower | Loan Amount |
|---|---|---|---|
| Open | Yeager James A | $548,250 | |
| Previous Owner | To Todd E Pesavento | $229,500 |
Source: Public Records
Tax History
| Year | Tax Paid | Tax Assessment Tax Assessment Total Assessment is a certain percentage of the fair market value that is determined by local assessors to be the total taxable value of land and additions on the property. | Land | Improvement |
|---|---|---|---|---|
| 2025 | $16,190 | $279,660 | $126,320 | $153,340 |
| 2024 | $16,190 | $279,660 | $126,320 | $153,340 |
| 2023 | $15,990 | $279,650 | $126,315 | $153,335 |
| 2022 | $13,557 | $194,010 | $77,180 | $116,830 |
| 2021 | $12,001 | $194,010 | $77,180 | $116,830 |
| 2020 | $11,895 | $194,010 | $77,180 | $116,830 |
| 2019 | $12,095 | $174,410 | $77,180 | $97,230 |
| 2018 | $11,183 | $174,410 | $77,180 | $97,230 |
| 2017 | $11,225 | $174,410 | $77,180 | $97,230 |
| 2016 | $10,349 | $155,020 | $68,500 | $86,520 |
| 2015 | $10,340 | $155,020 | $68,500 | $86,520 |
| 2014 | $10,252 | $155,020 | $68,500 | $86,520 |
| 2013 | $4,945 | $140,910 | $62,265 | $78,645 |
Source: Public Records
Map
Nearby Homes
- 1869 Tewksbury Rd
- 1923 Chatfield Rd
- 2208 Arlington Ave
- 1632 Grenoble Rd
- 2028 Wyandotte Rd
- 1920 Edgemont Rd
- 2095 Tremont Rd
- 1565 Berkshire Rd
- 1942 Bedford Rd
- 1951 Glenn Ave
- 1956 Glenn Ave
- 2583 Wexford Rd
- 1508 Barrington Rd
- 2165 S Parkway Dr
- 1455 Berkshire Rd
- 1875 Roxbury Rd
- 1876 Westwood Ave
- 1798 Andover Rd
- 1860 Elmwood Ave
- 2528 Tremont Rd
- 1840 Baldridge Rd
- 1826 Baldridge Rd
- 1863 Suffolk Rd
- 1871 Suffolk Rd
- 1847 Suffolk Rd
- 1843 Baldridge Rd
- 1820 Baldridge Rd
- 1837 Baldridge Rd
- 1849 Baldridge Rd
- 1870 Baldridge Rd
- 1829 Baldridge Rd
- 1841 Suffolk Rd
- 1885 Suffolk Rd
- 1816 Baldridge Rd
- 1821 Baldridge Rd
- 1865 Baldridge Rd
- 1880 Baldridge Rd
- 1835 Suffolk Rd
- 1895 Suffolk Rd
- 1815 Baldridge Rd
Your Personal Tour Guide
Ask me questions while you tour the home.