
Seller's Agent in 2016
David Coy
Red Cedar Real Estate
(571) 354-0505
217 Total Sales
Estimated Value: $428,000 - $538,000
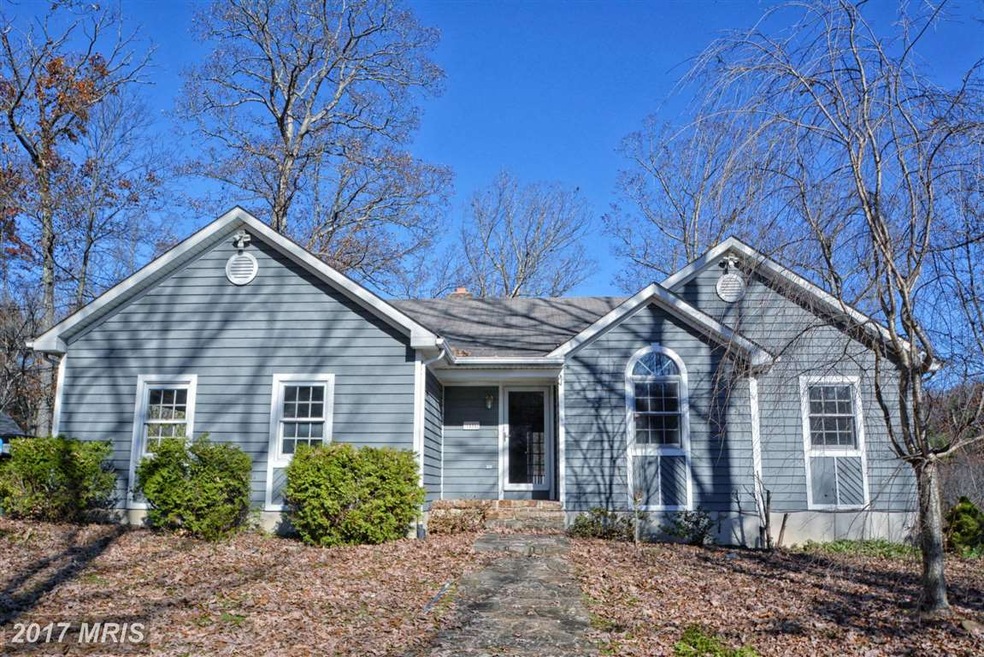
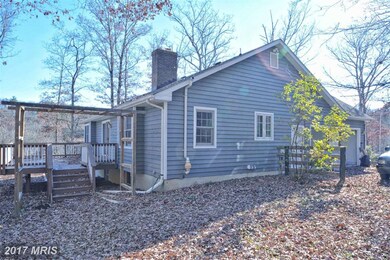
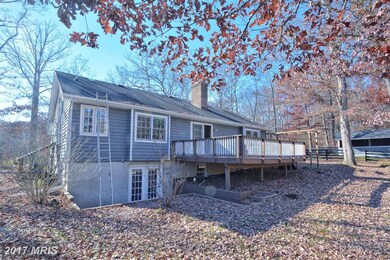
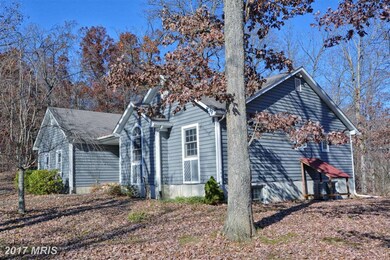
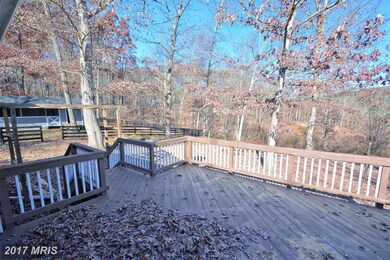
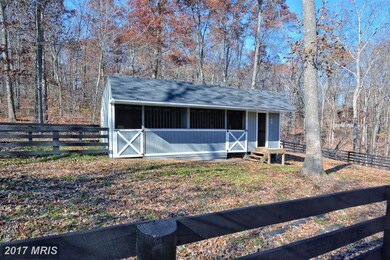
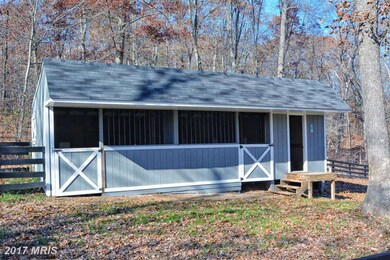
***NICE HORSE PROPERTY**3 BEDROOM CONTEMPORARY WITH APPROX 3000 SQ FT OF LIVING SPACE ON 2 FINISHED LEVELS**EXTRA KITCHEN IN BASEMENT**NICE DECK, SHED, 5 ACRES- FENCED AREAS**INCLUDES 2 BARNS THAT FIT 2 HORSES EACH**DOES NOT INCLUDE 10 ACRE LOT AND BARN ADJACENT TO PROPERTY**NICE HARDWOODS, FRESHLY PAINTED & READY TO MOVE INTO! NEW HVAC & NEW CARPET!
Last Agent to Sell the Property
(571) 354-0505 davidcoy@coyrealestate.com Red Cedar Real Estate License #0225202963 Listed on: 11/06/2015
Last Buyer's Agent
(540) 665-8570 contact@grcrealestate.com Goldizen, Riley & Company Real Estate
| Date | Buyer | Sale Price | Title Company |
|---|---|---|---|
| Potter Robert M | $250,000 | Attorney | |
| Ffc Properties Llc | $63,861 | -- | |
| Jackson Margaret M | $149,900 | -- |
| Date | Status | Borrower | Loan Amount |
|---|---|---|---|
| Open | Potter Robert M | $200,000 | |
| Previous Owner | Ffc Properties Llc | $47,896 | |
| Previous Owner | Jackson Margaret M | $142,400 |
| Date | Event | Price | List to Sale | Price per Sq Ft |
|---|---|---|---|---|
| 10/06/2016 10/06/16 | Sold | $250,000 | -2.0% | $83 / Sq Ft |
| 09/01/2016 09/01/16 | Pending | -- | -- | -- |
| 08/26/2016 08/26/16 | Price Changed | $255,000 | -1.9% | $84 / Sq Ft |
| 08/13/2016 08/13/16 | Price Changed | $260,000 | -1.3% | $86 / Sq Ft |
| 08/10/2016 08/10/16 | Price Changed | $263,500 | -0.6% | $87 / Sq Ft |
| 08/04/2016 08/04/16 | Price Changed | $265,000 | -1.1% | $88 / Sq Ft |
| 07/21/2016 07/21/16 | Price Changed | $268,000 | -0.2% | $89 / Sq Ft |
| 07/19/2016 07/19/16 | Price Changed | $268,500 | -0.2% | $89 / Sq Ft |
| 07/15/2016 07/15/16 | Price Changed | $269,000 | -0.4% | $89 / Sq Ft |
| 07/06/2016 07/06/16 | Price Changed | $270,000 | -0.7% | $89 / Sq Ft |
| 06/24/2016 06/24/16 | Price Changed | $272,000 | -1.1% | $90 / Sq Ft |
| 05/19/2016 05/19/16 | Price Changed | $275,000 | -0.4% | $91 / Sq Ft |
| 05/13/2016 05/13/16 | Price Changed | $276,000 | -0.4% | $91 / Sq Ft |
| 05/05/2016 05/05/16 | Price Changed | $277,000 | -0.4% | $92 / Sq Ft |
| 04/30/2016 04/30/16 | Price Changed | $278,000 | -0.2% | $92 / Sq Ft |
| 04/27/2016 04/27/16 | For Sale | $278,500 | 0.0% | $92 / Sq Ft |
| 04/12/2016 04/12/16 | Pending | -- | -- | -- |
| 04/05/2016 04/05/16 | Price Changed | $278,500 | -0.5% | $92 / Sq Ft |
| 03/24/2016 03/24/16 | Price Changed | $280,000 | -1.8% | $93 / Sq Ft |
| 03/18/2016 03/18/16 | Price Changed | $285,000 | -1.0% | $94 / Sq Ft |
| 03/09/2016 03/09/16 | Price Changed | $287,800 | -1.4% | $95 / Sq Ft |
| 03/01/2016 03/01/16 | Price Changed | $292,000 | -1.0% | $97 / Sq Ft |
| 02/25/2016 02/25/16 | Price Changed | $295,000 | -0.8% | $98 / Sq Ft |
| 02/22/2016 02/22/16 | Price Changed | $297,500 | -0.7% | $98 / Sq Ft |
| 02/12/2016 02/12/16 | Price Changed | $299,500 | -0.8% | $99 / Sq Ft |
| 02/05/2016 02/05/16 | Price Changed | $302,000 | -0.5% | $100 / Sq Ft |
| 02/03/2016 02/03/16 | Price Changed | $303,500 | -0.5% | $100 / Sq Ft |
| 01/28/2016 01/28/16 | Price Changed | $305,000 | -3.2% | $101 / Sq Ft |
| 01/15/2016 01/15/16 | Price Changed | $315,000 | -5.5% | $104 / Sq Ft |
| 01/13/2016 01/13/16 | Price Changed | $333,500 | +5.9% | $110 / Sq Ft |
| 12/28/2015 12/28/15 | Price Changed | $315,000 | -1.6% | $104 / Sq Ft |
| 12/19/2015 12/19/15 | Price Changed | $320,000 | -0.6% | $106 / Sq Ft |
| 12/10/2015 12/10/15 | Price Changed | $322,000 | -0.9% | $106 / Sq Ft |
| 12/08/2015 12/08/15 | Price Changed | $325,000 | -1.5% | $107 / Sq Ft |
| 11/30/2015 11/30/15 | Price Changed | $330,000 | -2.9% | $109 / Sq Ft |
| 11/24/2015 11/24/15 | Price Changed | $340,000 | -1.4% | $112 / Sq Ft |
| 11/19/2015 11/19/15 | Price Changed | $345,000 | -1.4% | $114 / Sq Ft |
| 11/06/2015 11/06/15 | For Sale | $350,000 | -- | $116 / Sq Ft |
| Year | Tax Paid | Tax Assessment Tax Assessment Total Assessment is a certain percentage of the fair market value that is determined by local assessors to be the total taxable value of land and additions on the property. | Land | Improvement |
|---|---|---|---|---|
| 2025 | $2,124 | $442,540 | $90,000 | $352,540 |
| 2024 | $963 | $377,700 | $71,500 | $306,200 |
| 2023 | $1,926 | $377,700 | $71,500 | $306,200 |
| 2022 | $1,820 | $298,400 | $63,500 | $234,900 |
| 2021 | $1,820 | $298,400 | $63,500 | $234,900 |
| 2020 | $1,610 | $263,900 | $63,500 | $200,400 |
| 2019 | $1,610 | $263,900 | $63,500 | $200,400 |
| 2018 | $1,531 | $250,900 | $62,700 | $188,200 |
| 2017 | $1,505 | $250,900 | $62,700 | $188,200 |
| 2016 | $1,390 | $231,700 | $50,000 | $181,700 |
| 2015 | $1,298 | $231,700 | $50,000 | $181,700 |
| 2014 | $653 | $221,600 | $50,000 | $171,600 |
Seller's Agent in 2016
David Coy
Red Cedar Real Estate
(571) 354-0505
217 Total Sales
T
Buyer's Agent in 2016
Tyler Thompson
Goldizen, Riley & Company Real Estate
(540) 303-3587
1 Total Sale
Source: Bright MLS
MLS Number: 1001325953
APN: 07A-13E
Disclaimer: Certain information contained herein is derived from information provided by parties other than Homes.com. All information provided is deemed reliable, but is not guaranteed to be accurate and should be independently verified.
![]() The data relating to real estate for sale on this website appears in part through the BRIGHT Internet Data Exchange program, a voluntary cooperative exchange of property listing data between licensed real estate brokerage firms, and is provided by BRIGHT through a licensing agreement.
The data relating to real estate for sale on this website appears in part through the BRIGHT Internet Data Exchange program, a voluntary cooperative exchange of property listing data between licensed real estate brokerage firms, and is provided by BRIGHT through a licensing agreement.
Listing information is from various brokers who participate in the Bright MLS IDX program and not all listings may be visible on the site.
The property information being provided on or through the website is for the personal, non-commercial use of consumers and such information may not be used for any purpose other than to identify prospective properties consumers may be interested in purchasing.
Some properties which appear for sale on the website may no longer be available because they are for instance, under contract, sold or are no longer being offered for sale.
Property information displayed is deemed reliable but is not guaranteed.
Copyright 2026 Bright MLS, Inc.
Ask me questions while you tour the home.