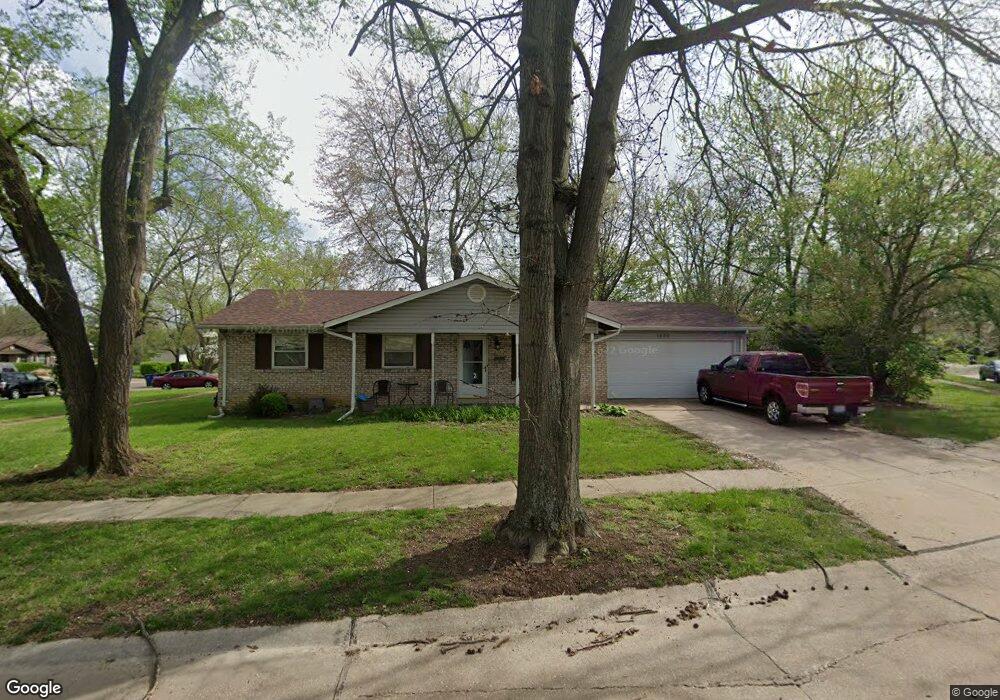
1856 Stilton Ct Florissant, MO 63031
Estimated Value: $197,000 - $222,503
3
Beds
2
Baths
1,454
Sq Ft
$144/Sq Ft
Est. Value
About This Home
This home is located at 1856 Stilton Ct, Florissant, MO 63031 and is currently estimated at $208,876, approximately $143 per square foot. 1856 Stilton Ct is a home located in St. Louis County with nearby schools including Lusher Elementary School, Northwest Middle School, and Hazelwood West High School.
Ownership History
Date
Name
Owned For
Owner Type
Purchase Details
Closed on
Oct 11, 2022
Sold by
Richardson Steven Brian and Richardson Andrea Beatrice
Bought by
Richardson Steven Brian
Current Estimated Value
Home Financials for this Owner
Home Financials are based on the most recent Mortgage that was taken out on this home.
Original Mortgage
$160,000
Outstanding Balance
$153,550
Interest Rate
5.66%
Mortgage Type
VA
Estimated Equity
$55,326
Purchase Details
Closed on
May 28, 2004
Sold by
Schwein Mark
Bought by
Richardson Steven Brian and Richardson Andrea Beatrice
Home Financials for this Owner
Home Financials are based on the most recent Mortgage that was taken out on this home.
Original Mortgage
$110,675
Interest Rate
8.99%
Mortgage Type
Purchase Money Mortgage
Purchase Details
Closed on
Feb 6, 1998
Sold by
Thompson Schwein Linda
Bought by
Schwein Mark
Create a Home Valuation Report for This Property
The Home Valuation Report is an in-depth analysis detailing your home's value as well as a comparison with similar homes in the area
Home Values in the Area
Average Home Value in this Area
Purchase History
| Date | Buyer | Sale Price | Title Company |
|---|---|---|---|
| Richardson Steven Brian | -- | None Listed On Document | |
| Richardson Steven Brian | $116,500 | Nations Title Agency Of Miss | |
| Schwein Mark | -- | -- |
Source: Public Records
Mortgage History
| Date | Status | Borrower | Loan Amount |
|---|---|---|---|
| Open | Richardson Steven Brian | $160,000 | |
| Previous Owner | Richardson Steven Brian | $110,675 |
Source: Public Records
Tax History Compared to Growth
Tax History
| Year | Tax Paid | Tax Assessment Tax Assessment Total Assessment is a certain percentage of the fair market value that is determined by local assessors to be the total taxable value of land and additions on the property. | Land | Improvement |
|---|---|---|---|---|
| 2025 | $3,054 | $37,110 | $5,510 | $31,600 |
| 2024 | $3,054 | $34,990 | $3,150 | $31,840 |
| 2023 | $3,050 | $34,990 | $3,150 | $31,840 |
| 2022 | $2,617 | $26,720 | $3,630 | $23,090 |
| 2021 | $2,579 | $26,720 | $3,630 | $23,090 |
| 2020 | $2,323 | $22,380 | $3,630 | $18,750 |
| 2019 | $2,288 | $22,380 | $3,630 | $18,750 |
| 2018 | $2,097 | $18,850 | $2,450 | $16,400 |
| 2017 | $2,095 | $18,850 | $2,450 | $16,400 |
| 2016 | $2,112 | $18,750 | $2,830 | $15,920 |
| 2015 | $2,067 | $18,750 | $2,830 | $15,920 |
| 2014 | $2,001 | $18,700 | $3,630 | $15,070 |
Source: Public Records
Map
Nearby Homes
- 1767 Stilton Ct
- 1834 Night Dr
- 2216 Foggy Bottom Dr
- 2171 Farthing Ct
- 2347 Farflung Dr
- 2334 White Ash Ct
- 2314 White Ash Ct
- 2106 Kingsford Dr
- 2 Meadows
- 1911 Suns Up Ct Unit 4
- 2145 Flamingo Dr
- 2490 Mullanphy Ln
- 1907 High Sun Dr
- 2 Ashford at River Bluffs Manors
- 2 Berwick at River Bluffs Manors
- 2 Meadows
- 1863 High Sun Dr Unit 51863
- 2 Maple at River Bluffs Manors
- 2 Royal II at River Bluffs Manors
- 2 Aspen II at River Bluffs Manors