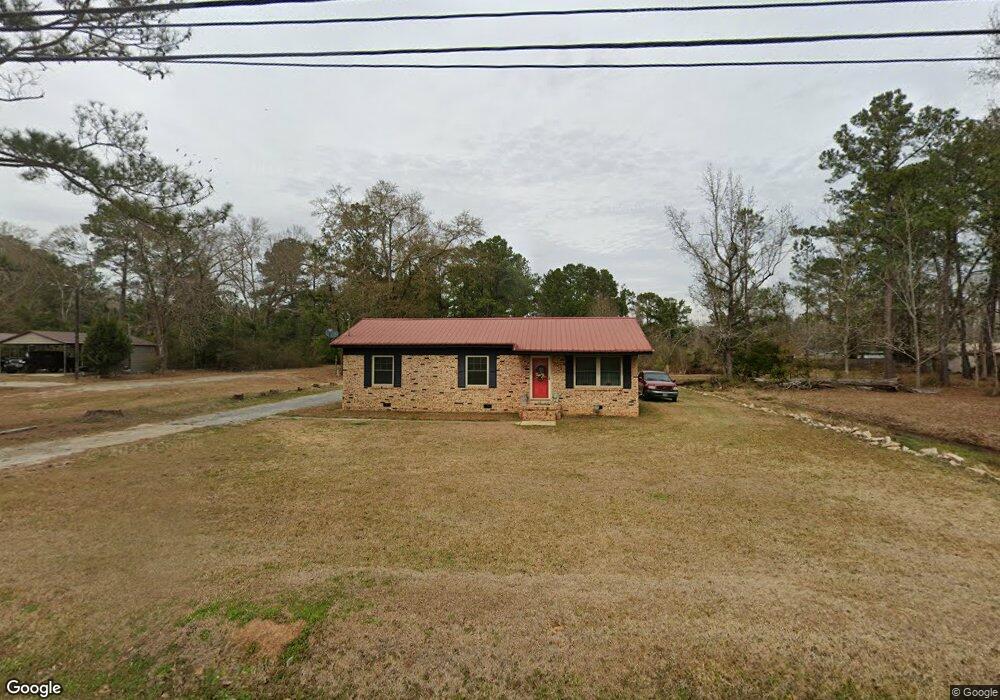
18569 E South Blvd Blakely, GA 39823
Estimated Value: $115,000
--
Bed
1
Bath
696
Sq Ft
$165/Sq Ft
Est. Value
About This Home
This home is located at 18569 E South Blvd, Blakely, GA 39823 and is currently estimated at $115,000, approximately $165 per square foot. 18569 E South Blvd is a home located in Early County with nearby schools including Early County Elementary School, Early County Middle School, and Early County High School.
Ownership History
Date
Name
Owned For
Owner Type
Purchase Details
Closed on
Aug 11, 2014
Sold by
Freeman Nell Fields
Bought by
Fields Joseph
Current Estimated Value
Purchase Details
Closed on
May 21, 2014
Sold by
Fields Dewana S
Bought by
Fields Joseph and Freeman Nell Fields
Purchase Details
Closed on
Sep 28, 1977
Bought by
Fields Nellie and Fields Alon
Create a Home Valuation Report for This Property
The Home Valuation Report is an in-depth analysis detailing your home's value as well as a comparison with similar homes in the area
Home Values in the Area
Average Home Value in this Area
Purchase History
| Date | Buyer | Sale Price | Title Company |
|---|---|---|---|
| Fields Joseph | -- | -- | |
| Freeman Nell Fields | -- | -- | |
| Fields Dewana | -- | -- | |
| Fields Joseph | -- | -- | |
| Fields Nellie | -- | -- |
Source: Public Records
Tax History Compared to Growth
Tax History
| Year | Tax Paid | Tax Assessment Tax Assessment Total Assessment is a certain percentage of the fair market value that is determined by local assessors to be the total taxable value of land and additions on the property. | Land | Improvement |
|---|---|---|---|---|
| 2024 | $623 | $23,118 | $22,583 | $535 |
| 2023 | $589 | $23,118 | $22,583 | $535 |
| 2022 | $526 | $20,842 | $20,307 | $535 |
| 2021 | $532 | $20,911 | $20,307 | $604 |
| 2020 | $523 | $20,911 | $20,307 | $604 |
| 2019 | $538 | $20,907 | $20,307 | $600 |
| 2018 | $549 | $21,359 | $20,307 | $1,052 |
| 2017 | $549 | $21,303 | $20,307 | $996 |
| 2016 | $566 | $21,248 | $20,307 | $941 |
| 2015 | -- | $16,996 | $16,056 | $941 |
| 2014 | -- | $32,512 | $31,572 | $941 |
| 2013 | -- | $31,597 | $30,656 | $940 |
Source: Public Records
Map
Nearby Homes
- 74 S Lancelot St
- 18802 E South Blvd
- 600 Chattahoochee Ave
- 00 Garden Dr
- 76 S Jefferson Ave
- 73 W Westward Ave
- 000 Georgia 62
- 337 College St
- 7507 Old Lucile Rd
- 556 Flowers Dr
- Stein Rd
- 234 College St
- 73 Grove Place
- 21141 Lucile Rd
- 934 Southside Dr
- 11401 Columbia St
- 203 Willow Glen Dr
- 216 Willow Glen Dr
- 21 E Railroad Ln
- 23 Dothan Rd
- 18569 E South Blvd
- 18537 E South Blvd
- 18601 E South Blvd
- 656 Jesse Johnson Dr
- 18513 E South Blvd
- 640 Jesse Johnson Dr
- 18617 E South Blvd
- 612 Jesse Johnson Dr
- 18499 E South Blvd
- 689 Jesse Johnson Dr
- 552 Jesse Johnson Dr
- 18461 E South Blvd
- 619 Jesse Johnson Dr
- 571 Jesse Johnson Dr
- 601 Jesse Johnson Dr
- 132 Poplar St
- 537 Jesse Johnson Dr
- 18415 E South Blvd
- 30 S Lancelot St
- 44 S Lancelot St