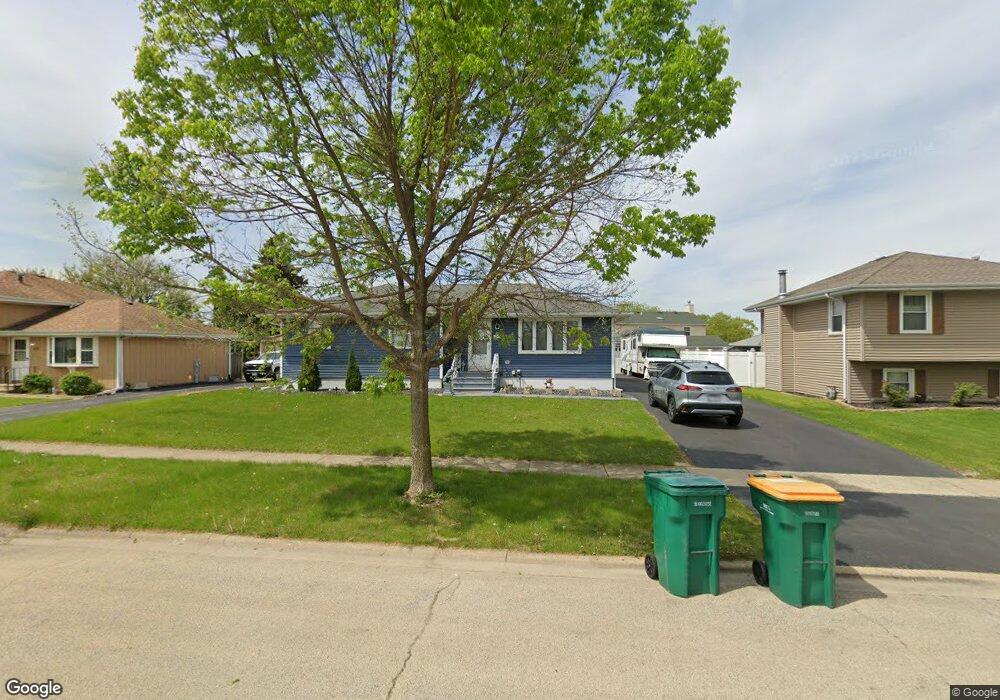
1857 Delrose St Joliet, IL 60435
Estimated Value: $320,807 - $344,000
3
Beds
2
Baths
1,232
Sq Ft
$268/Sq Ft
Est. Value
About This Home
This home is located at 1857 Delrose St, Joliet, IL 60435 and is currently estimated at $329,952, approximately $267 per square foot. 1857 Delrose St is a home located in Will County with nearby schools including Grand Prairie Elementary School, Timber Ridge Middle School, and Plainfield Central High School.
Ownership History
Date
Name
Owned For
Owner Type
Purchase Details
Closed on
Jun 2, 2017
Sold by
Pellegrini Tricia M and Tricia M Pellegrini Trust
Bought by
Ruiz Gustavo
Current Estimated Value
Home Financials for this Owner
Home Financials are based on the most recent Mortgage that was taken out on this home.
Original Mortgage
$174,800
Outstanding Balance
$146,769
Interest Rate
4.37%
Mortgage Type
New Conventional
Estimated Equity
$183,183
Purchase Details
Closed on
Sep 9, 2016
Sold by
Pellegrini Tricia M and Kenneth C Falkenberg Trust
Bought by
Pellegrini Tricia M and Tricia M Pellegrini Trust
Purchase Details
Closed on
Jul 21, 2004
Sold by
Falkenberg Kenneth C
Bought by
Falkenberg Kenneth C and Kenneth C Falkenberg Trust
Purchase Details
Closed on
Mar 28, 1997
Sold by
Falkenberg Kenneth C and Falkenberg Patricia A
Bought by
Falkenberg Kenneth C and Falkenberg Patricia A
Create a Home Valuation Report for This Property
The Home Valuation Report is an in-depth analysis detailing your home's value as well as a comparison with similar homes in the area
Home Values in the Area
Average Home Value in this Area
Purchase History
| Date | Buyer | Sale Price | Title Company |
|---|---|---|---|
| Ruiz Gustavo | $184,000 | Fidelity National Title Ins | |
| Pellegrini Tricia M | -- | Attorney | |
| Falkenberg Kenneth C | -- | -- | |
| Falkenberg Kenneth C | -- | -- |
Source: Public Records
Mortgage History
| Date | Status | Borrower | Loan Amount |
|---|---|---|---|
| Open | Ruiz Gustavo | $174,800 |
Source: Public Records
Tax History Compared to Growth
Tax History
| Year | Tax Paid | Tax Assessment Tax Assessment Total Assessment is a certain percentage of the fair market value that is determined by local assessors to be the total taxable value of land and additions on the property. | Land | Improvement |
|---|---|---|---|---|
| 2024 | $5,305 | $82,078 | $23,659 | $58,419 |
| 2023 | $5,305 | $74,131 | $21,368 | $52,763 |
| 2022 | $4,664 | $65,390 | $18,848 | $46,542 |
| 2021 | $4,411 | $61,112 | $17,615 | $43,497 |
| 2020 | $4,339 | $59,378 | $17,115 | $42,263 |
| 2019 | $4,180 | $56,578 | $16,308 | $40,270 |
| 2018 | $3,837 | $51,356 | $15,323 | $36,033 |
| 2017 | $3,713 | $48,803 | $14,561 | $34,242 |
| 2016 | $3,628 | $46,545 | $13,887 | $32,658 |
| 2015 | $3,364 | $43,602 | $13,009 | $30,593 |
| 2014 | $3,364 | $42,063 | $12,550 | $29,513 |
| 2013 | $3,364 | $42,063 | $12,550 | $29,513 |
Source: Public Records
Map
Nearby Homes
- 1874 Corregidor St
- 1921 Cecily Dr
- 1945 Calla Dr
- 1900 Essington Rd
- 1804 Maserati Dr
- 1802 Maserati Dr
- 1810 Foxfield Dr
- 3001 Theodore St
- 2703 Oak Ridge Ln
- 1925 Timbers Edge Cir
- 2812 Vimy Ridge Dr
- 1702 Timberline Dr
- 2925 Somme St
- 2533 Waterford Dr
- 2528 Silver Rock Dr
- 1617 Timberline Dr
- 1920 Heather Ln
- 2337 Golfview Dr Unit 10
- 1422 Citadel Dr Unit 4
- 1930 Heather Ln
- 1855 Delrose St
- 1859 Delrose St
- 1856 Cecily Dr
- 1858 Cecily Dr
- 1901 Delrose St Unit B
- 1854 Cecily Dr
- 1900 Cecily Dr
- 1858 Delrose St
- 1851 Delrose St
- 1856 Delrose St
- 1900 Delrose St Unit B
- 1852 Cecily Dr
- 1903 Delrose St
- 1902 Cecily Dr
- 1902 Delrose St
- 1854 Delrose St Unit B
- 1852 Delrose St
- 1855 Cecily Dr
- 1849 Delrose St
- 1905 Delrose St