1857 Lazy Cove Ct Lithia Springs, GA 30122
Lithia Springs NeighborhoodEstimated Value: $255,051 - $305,000
3
Beds
3
Baths
1,406
Sq Ft
$201/Sq Ft
Est. Value
About This Home
This home is located at 1857 Lazy Cove Ct, Lithia Springs, GA 30122 and is currently estimated at $282,763, approximately $201 per square foot. 1857 Lazy Cove Ct is a home located in Douglas County with nearby schools including Factory Shoals Elementary School, Factory Shoals Middle School, and New Manchester High School.
Ownership History
Date
Name
Owned For
Owner Type
Purchase Details
Closed on
Feb 25, 2022
Sold by
S & L Worlds Llc
Bought by
Owens Larry
Current Estimated Value
Purchase Details
Closed on
Feb 25, 2015
Sold by
Emeka Frank Edwin
Bought by
S & L Worlds Llc
Purchase Details
Closed on
Sep 12, 2014
Sold by
New Hud Inc
Bought by
Emeka Frank Edwin
Purchase Details
Closed on
Aug 11, 2014
Sold by
Jpmorgan Chase Bank Na
Bought by
New Hud Inc
Purchase Details
Closed on
Apr 22, 2014
Sold by
Federal National Mortgage Association
Bought by
Jpmorgan Chase Bank National A
Purchase Details
Closed on
May 5, 2009
Sold by
Chase Home Finance Llc
Bought by
Federal National Mortgage Association
Purchase Details
Closed on
May 2, 2003
Sold by
Sisson Rodney
Bought by
Baltazar Beltran
Home Financials for this Owner
Home Financials are based on the most recent Mortgage that was taken out on this home.
Original Mortgage
$144,500
Interest Rate
5.76%
Mortgage Type
New Conventional
Create a Home Valuation Report for This Property
The Home Valuation Report is an in-depth analysis detailing your home's value as well as a comparison with similar homes in the area
Home Values in the Area
Average Home Value in this Area
Purchase History
| Date | Buyer | Sale Price | Title Company |
|---|---|---|---|
| Owens Larry | -- | None Listed On Document | |
| S & L Worlds Llc | $110,000 | -- | |
| Emeka Frank Edwin | $85,000 | -- | |
| New Hud Inc | -- | -- | |
| Jpmorgan Chase Bank National A | -- | -- | |
| Federal National Mortgage Association | -- | -- | |
| Chase Home Finance Llc | $70,000 | -- | |
| Baltazar Beltran | $149,000 | -- |
Source: Public Records
Mortgage History
| Date | Status | Borrower | Loan Amount |
|---|---|---|---|
| Previous Owner | Baltazar Beltran | $144,500 |
Source: Public Records
Tax History Compared to Growth
Tax History
| Year | Tax Paid | Tax Assessment Tax Assessment Total Assessment is a certain percentage of the fair market value that is determined by local assessors to be the total taxable value of land and additions on the property. | Land | Improvement |
|---|---|---|---|---|
| 2024 | $1,115 | $93,064 | $21,600 | $71,464 |
| 2023 | $1,115 | $93,064 | $21,600 | $71,464 |
| 2022 | $3,095 | $93,064 | $21,600 | $71,464 |
| 2021 | $2,180 | $64,844 | $13,080 | $51,764 |
| 2020 | $2,206 | $64,844 | $13,080 | $51,764 |
| 2019 | $2,002 | $62,848 | $13,080 | $49,768 |
| 2018 | $1,969 | $61,492 | $13,080 | $48,412 |
| 2017 | $1,807 | $55,220 | $13,080 | $42,140 |
| 2016 | $1,476 | $44,000 | $11,406 | $32,594 |
| 2015 | $1,177 | $34,000 | $8,820 | $25,180 |
| 2014 | $1,390 | $39,684 | $12,000 | $27,684 |
| 2013 | -- | $39,616 | $12,000 | $27,616 |
Source: Public Records
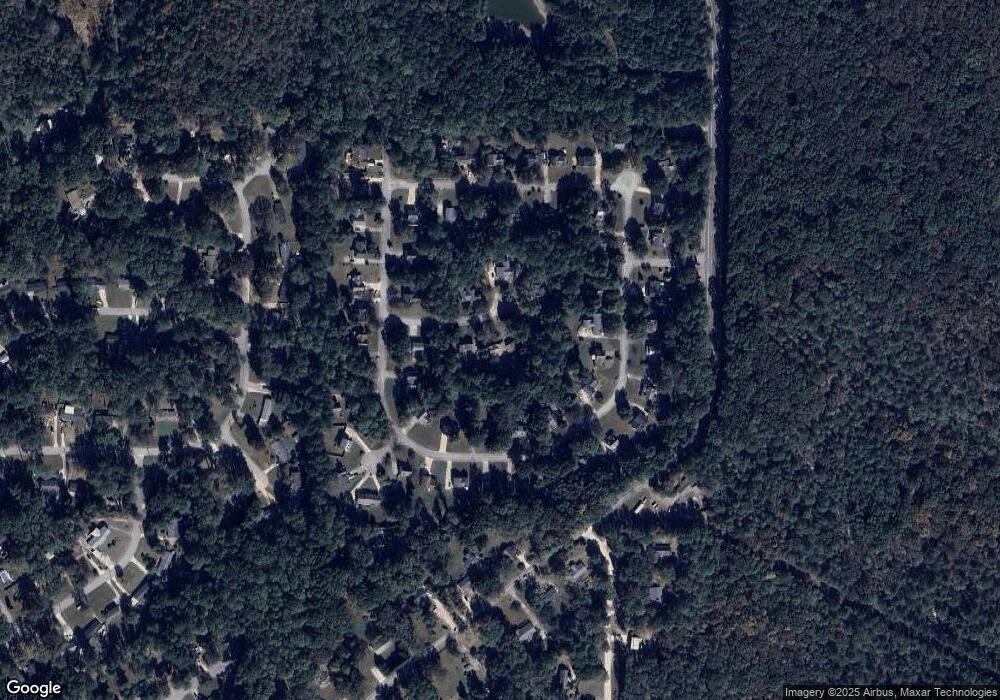
Map
Nearby Homes
- 2087 Chestnut Way
- 2275 Chestnut Log Loop
- 2322 Chestnut Log Loop
- 2344 Mount Vernon Rd
- 2182 Ann Ln
- 1940 Lee
- 1815 Lee Rd
- 2499 Chestnut Log Loop
- 8684 Hickory Ln
- 3570 Briar Dr
- 2436 Falls River Dr
- LOT 27 Chestnut Ln
- 3460 Meadowview Dr
- 2435 Arlington Ct
- 3646 Briar Dr
- 3652 Sweetbriar Cir
- 3552 Meadowview Dr
- 3686 Sweetbriar Cir
- 3790 Sweetbriar Cir
- 3636 Meadowview Dr
- 1861 Lazy Cove Ct
- 1853 Lazy Cove Ct
- 2067 E Lotus Point Dr
- 2071 E Lotus Point Dr
- 2059 E Lotus Point Dr
- 2051 E Lotus Point Dr Unit 2
- 2079 E Lotus Point Dr Unit 2
- 2043 E Lotus Point Dr
- 1866 Lazy Cove Ct Unit 2
- 1858 Lazy Cove Ct
- 2095 W Lotus Point Dr
- 1862 Lazy Cove Ct Unit 2
- 2037 E Lotus Point Dr
- 2089 E Lotus Point Dr
- 2085 W Lotus Point Dr Unit 2
- 2101 W Lotus Point Dr Unit 2
- 2033 E Lotus Point Dr
- E Lotus
- E E Lotus Point Dr
- 2107 W Lotus Point Dr Unit 2