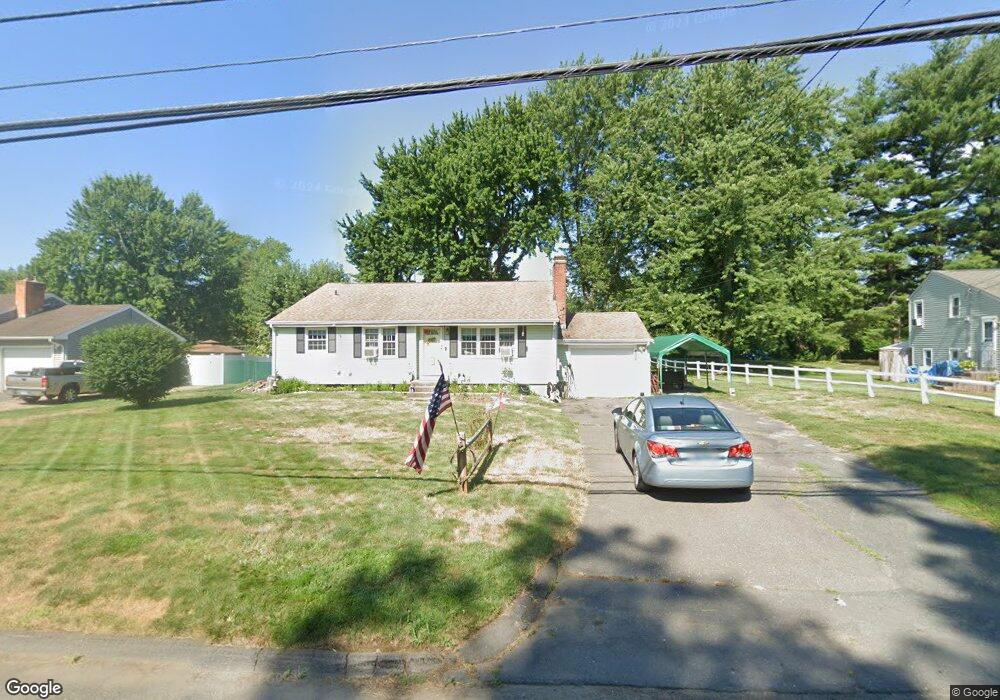
1857 Main St East Hartford, CT 06108
Estimated Value: $292,000 - $345,000
3
Beds
3
Baths
1,060
Sq Ft
$301/Sq Ft
Est. Value
About This Home
This home is located at 1857 Main St, East Hartford, CT 06108 and is currently estimated at $319,487, approximately $301 per square foot. 1857 Main St is a home located in Hartford County with nearby schools including Anna E. Norris School, East Hartford Middle School, and East Hartford High School.
Ownership History
Date
Name
Owned For
Owner Type
Purchase Details
Closed on
May 31, 2007
Sold by
Bowie Thomas
Bought by
Ehmke William
Current Estimated Value
Home Financials for this Owner
Home Financials are based on the most recent Mortgage that was taken out on this home.
Original Mortgage
$216,558
Interest Rate
6.24%
Mortgage Type
VA
Purchase Details
Closed on
May 3, 1999
Sold by
Galetta Charles A and Galetta Loretta S
Bought by
Bowie Thomas B
Create a Home Valuation Report for This Property
The Home Valuation Report is an in-depth analysis detailing your home's value as well as a comparison with similar homes in the area
Home Values in the Area
Average Home Value in this Area
Purchase History
| Date | Buyer | Sale Price | Title Company |
|---|---|---|---|
| Ehmke William | $424,000 | -- | |
| Bowie Thomas B | $83,000 | -- |
Source: Public Records
Mortgage History
| Date | Status | Borrower | Loan Amount |
|---|---|---|---|
| Open | Bowie Thomas B | $228,316 | |
| Closed | Bowie Thomas B | $216,558 | |
| Previous Owner | Bowie Thomas B | $50,000 | |
| Previous Owner | Bowie Thomas B | $102,000 |
Source: Public Records
Tax History Compared to Growth
Tax History
| Year | Tax Paid | Tax Assessment Tax Assessment Total Assessment is a certain percentage of the fair market value that is determined by local assessors to be the total taxable value of land and additions on the property. | Land | Improvement |
|---|---|---|---|---|
| 2025 | $6,822 | $148,630 | $43,090 | $105,540 |
| 2024 | $6,540 | $148,630 | $43,090 | $105,540 |
| 2023 | $6,323 | $148,630 | $43,090 | $105,540 |
| 2022 | $6,094 | $148,630 | $43,090 | $105,540 |
| 2021 | $5,618 | $113,840 | $32,640 | $81,200 |
| 2020 | $5,683 | $113,840 | $32,640 | $81,200 |
| 2019 | $5,591 | $113,840 | $32,640 | $81,200 |
| 2018 | $5,426 | $113,840 | $32,640 | $81,200 |
| 2017 | $5,356 | $113,840 | $32,640 | $81,200 |
| 2016 | $5,468 | $119,230 | $34,360 | $84,870 |
| 2015 | $5,397 | $117,680 | $34,360 | $83,320 |
| 2014 | $5,343 | $117,680 | $34,360 | $83,320 |
Source: Public Records
Map
Nearby Homes
- 39 Tiffany Rd
- 110 Goodwin St
- 50 Northbrook Ct
- 1589 Main St
- 67 Laurel St
- 29 Joanne Dr Unit 29
- 89 Henderson Dr
- 51 Wood Dr
- 22 Matthew Rd
- 80 Stanley St
- 15 Michael Ave
- 577 Goodwin St
- 181 Burnside Ave
- 51 Daniel St
- 265 Burnside Ave
- 10 Kenyon Place
- 453 Burnside Ave
- 52 Burnside Ave
- 98 Olmsted St
- 33 Kenyon Place