Estimated Value: $347,000 - $374,000
3
Beds
2
Baths
1,440
Sq Ft
$250/Sq Ft
Est. Value
About This Home
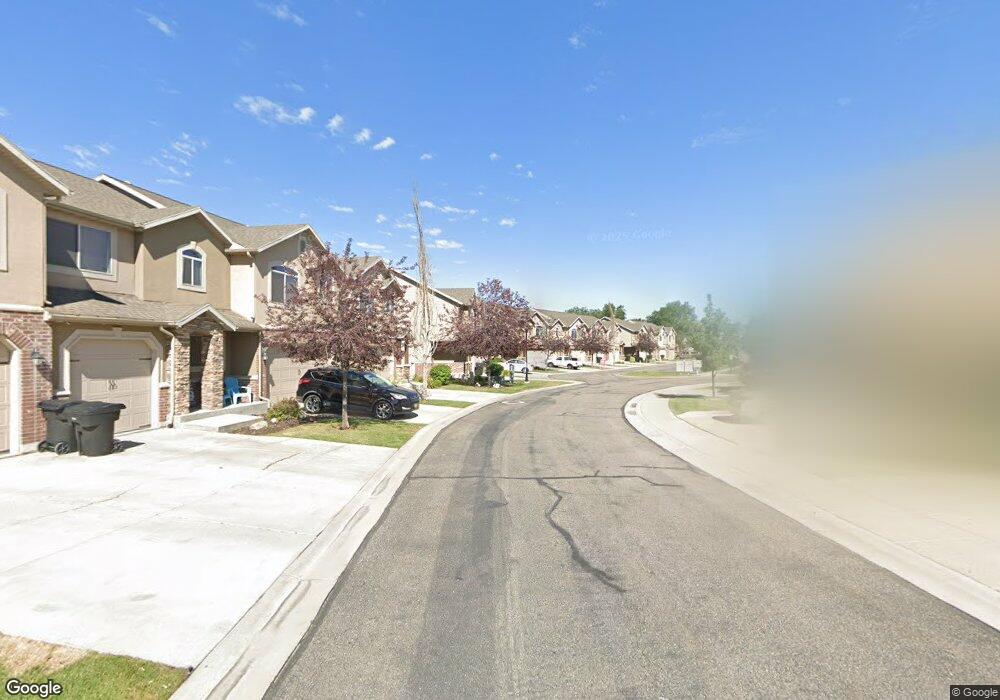
This home is located at 1857 W 5050 S, Roy, UT 84067 and is currently estimated at $359,309, approximately $249 per square foot. 1857 W 5050 S is a home located in Weber County with nearby schools including Lakeview Elementary School, Roy Junior High School, and Roy High School.
Ownership History
Date
Name
Owned For
Owner Type
Purchase Details
Closed on
Jul 21, 2020
Sold by
Nelson Chris
Bought by
Nelson Christopher G
Current Estimated Value
Home Financials for this Owner
Home Financials are based on the most recent Mortgage that was taken out on this home.
Original Mortgage
$137,500
Outstanding Balance
$122,152
Interest Rate
3.2%
Mortgage Type
New Conventional
Estimated Equity
$237,157
Purchase Details
Closed on
Oct 1, 2010
Sold by
Stoney Brook Cottages Cs Llc
Bought by
Nelson Chris
Home Financials for this Owner
Home Financials are based on the most recent Mortgage that was taken out on this home.
Original Mortgage
$167,641
Interest Rate
4.25%
Mortgage Type
FHA
Purchase Details
Closed on
Mar 18, 2009
Sold by
Stoney Brook Cottages Association Inc
Bought by
Stoney Brook Cottages C S Llc
Create a Home Valuation Report for This Property
The Home Valuation Report is an in-depth analysis detailing your home's value as well as a comparison with similar homes in the area
Home Values in the Area
Average Home Value in this Area
Purchase History
| Date | Buyer | Sale Price | Title Company |
|---|---|---|---|
| Nelson Christopher G | -- | Lincolnn Title Ins Agency | |
| Nelson Chris | -- | Lincoln Title Ins Agency | |
| Stoney Brook Cottages C S Llc | -- | None Available |
Source: Public Records
Mortgage History
| Date | Status | Borrower | Loan Amount |
|---|---|---|---|
| Open | Nelson Christopher G | $137,500 | |
| Closed | Nelson Chris | $167,641 |
Source: Public Records
Tax History Compared to Growth
Tax History
| Year | Tax Paid | Tax Assessment Tax Assessment Total Assessment is a certain percentage of the fair market value that is determined by local assessors to be the total taxable value of land and additions on the property. | Land | Improvement |
|---|---|---|---|---|
| 2025 | $1,877 | $331,155 | $90,000 | $241,155 |
| 2024 | $1,818 | $177,650 | $49,500 | $128,150 |
| 2023 | $1,809 | $177,100 | $49,500 | $127,600 |
| 2022 | $1,848 | $184,250 | $49,500 | $134,750 |
| 2021 | $1,560 | $258,000 | $35,000 | $223,000 |
| 2020 | $1,420 | $215,000 | $35,000 | $180,000 |
| 2019 | $1,420 | $203,000 | $30,000 | $173,000 |
| 2018 | $1,376 | $186,000 | $27,000 | $159,000 |
| 2017 | $1,248 | $159,000 | $27,000 | $132,000 |
| 2016 | $1,266 | $86,900 | $16,500 | $70,400 |
| 2015 | $1,228 | $86,900 | $16,500 | $70,400 |
| 2014 | $1,045 | $73,150 | $16,500 | $56,650 |
Source: Public Records
Map
Nearby Homes
- 5006 S 1800 W
- 1792 W 5025 S
- 1789 W 5000 S
- 1789 W 5050 S
- 1777 W 5050 S
- 4815 S 1800 W Unit 40
- 4729 S 1900 W
- 4848 S 2125 W
- 4602 Hathaway Dr
- 5140 S 2100 W
- 5256 S 2000 W
- 2179 W 4975 S
- 2148 W 4850 S
- 4593 Promenade Dr
- 5185 S 2100 W
- 4539 S 1800 W Unit 127
- 1705 W 4575 S
- 2038 W 4600 S
- 1766 W 4575 S
- 5140 S 2175 W