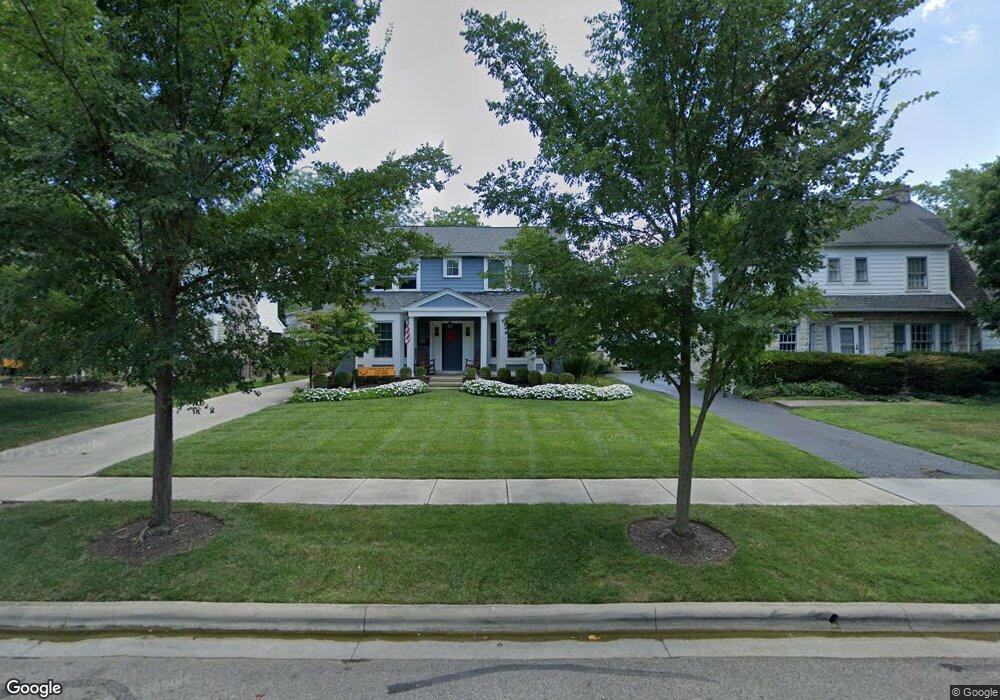
1858 Bedford Rd Columbus, OH 43212
Estimated Value: $882,000 - $1,097,136
4
Beds
2
Baths
2,584
Sq Ft
$375/Sq Ft
Est. Value
About This Home
This home is located at 1858 Bedford Rd, Columbus, OH 43212 and is currently estimated at $968,034, approximately $374 per square foot. 1858 Bedford Rd is a home located in Franklin County with nearby schools including Barrington Road Elementary School, Jones Middle School, and Upper Arlington High School.
Ownership History
Date
Name
Owned For
Owner Type
Purchase Details
Closed on
Mar 31, 2010
Sold by
Dehays Brad J and Dehays Jaeleen Clark
Bought by
Yaross Todd D and Yaross Jennifer S
Current Estimated Value
Home Financials for this Owner
Home Financials are based on the most recent Mortgage that was taken out on this home.
Original Mortgage
$314,105
Outstanding Balance
$214,319
Interest Rate
5.5%
Mortgage Type
FHA
Estimated Equity
$753,715
Purchase Details
Closed on
Jul 21, 2007
Sold by
Willis Judith and Grp Financial Services Corp
Bought by
Dehays Brad J
Home Financials for this Owner
Home Financials are based on the most recent Mortgage that was taken out on this home.
Original Mortgage
$239,450
Interest Rate
7.87%
Mortgage Type
Purchase Money Mortgage
Purchase Details
Closed on
Jun 1, 1978
Bought by
Willis Geary S and Willis Judith
Purchase Details
Closed on
May 1, 1978
Create a Home Valuation Report for This Property
The Home Valuation Report is an in-depth analysis detailing your home's value as well as a comparison with similar homes in the area
Home Values in the Area
Average Home Value in this Area
Purchase History
| Date | Buyer | Sale Price | Title Company |
|---|---|---|---|
| Yaross Todd D | $319,900 | Arrow Title | |
| Dehays Brad J | $266,000 | None Available | |
| Willis Geary S | -- | -- | |
| -- | $69,000 | -- |
Source: Public Records
Mortgage History
| Date | Status | Borrower | Loan Amount |
|---|---|---|---|
| Open | Yaross Todd D | $314,105 | |
| Previous Owner | Dehays Brad J | $239,450 |
Source: Public Records
Tax History Compared to Growth
Tax History
| Year | Tax Paid | Tax Assessment Tax Assessment Total Assessment is a certain percentage of the fair market value that is determined by local assessors to be the total taxable value of land and additions on the property. | Land | Improvement |
|---|---|---|---|---|
| 2024 | $18,923 | $326,870 | $119,460 | $207,410 |
| 2023 | $18,689 | $326,865 | $119,455 | $207,410 |
| 2022 | $17,852 | $255,470 | $65,980 | $189,490 |
| 2021 | $15,803 | $255,470 | $65,980 | $189,490 |
| 2020 | $13,313 | $217,150 | $65,980 | $151,170 |
| 2019 | $13,254 | $191,140 | $65,980 | $125,160 |
| 2018 | $7,774 | $191,140 | $65,980 | $125,160 |
| 2017 | $11,806 | $191,140 | $65,980 | $125,160 |
| 2016 | $10,361 | $155,200 | $51,210 | $103,990 |
| 2015 | $6,360 | $155,200 | $51,210 | $103,990 |
| 2014 | $7,885 | $119,220 | $51,210 | $68,010 |
| 2013 | $3,814 | $108,360 | $46,550 | $61,810 |
Source: Public Records
Map
Nearby Homes
- 1782 Wyandotte Rd
- 1733 Elmwood Ave
- 2110 Northwest Blvd
- 1661 Ashland Ave Unit 663
- 1655-1657 Ashland Ave
- 1561 Glenn Ave
- 2015 W 5th Ave Unit 211
- 2015 W 5th Ave Unit 102
- 2015 W 5th Ave Unit 108
- 1631 Roxbury Rd Unit F3
- 1631 Roxbury Rd Unit B6
- 1398 Lower Green Cir Unit 1398
- 1869 Tewksbury Rd
- 1535 Doone Rd
- 1459 Elmwood Ave Unit 1459
- 1565 Berkshire Rd
- 2063 Westover Rd
- 1364 W 7th Ave
- 00 W 7th Ave
- 1313 Lincoln Rd
- 1852 Bedford Rd
- 1868 Bedford Rd
- 1876 Bedford Rd
- 1857 Andover Rd
- 1845 Andover Rd
- 1824 Tremont Rd
- 1865 Andover Rd
- 1851 Bedford Rd
- 1859 Bedford Rd
- 1875 Andover Rd
- 1884 Bedford Rd
- 1867 Bedford Rd
- 1879 Bedford Rd
- 1883 Andover Rd
- 1852 Tremont Rd
- 1892 Bedford Rd
- 1885 Bedford Rd
- 1889 Andover Rd
- 1893 Bedford Rd
- 1850 Andover Rd