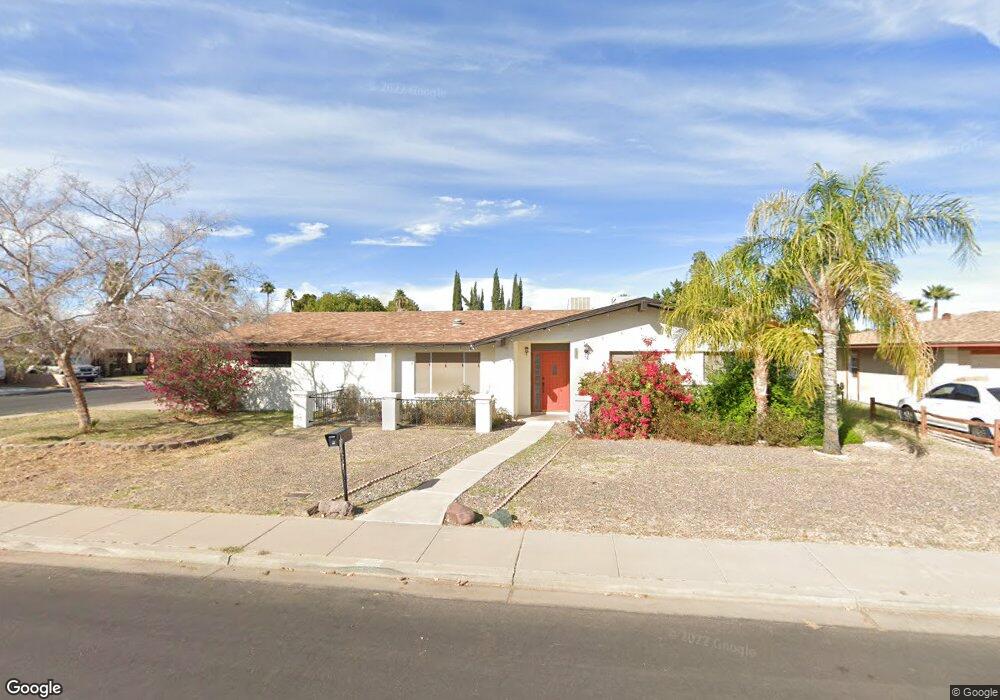
1858 E Des Moines St Mesa, AZ 85203
North Central Mesa NeighborhoodEstimated Value: $439,801 - $531,000
4
Beds
3
Baths
2,179
Sq Ft
$226/Sq Ft
Est. Value
About This Home
This home is located at 1858 E Des Moines St, Mesa, AZ 85203 and is currently estimated at $493,200, approximately $226 per square foot. 1858 E Des Moines St is a home located in Maricopa County with nearby schools including Michael T. Hughes Elementary School, Franklin at Brimhall Elementary School, and Franklin West Elementary School.
Ownership History
Date
Name
Owned For
Owner Type
Purchase Details
Closed on
Mar 23, 2015
Sold by
Brown Kim C and Brown Alice Jeanette
Bought by
Brown Kim C and Brown Alice Jeanette
Current Estimated Value
Home Financials for this Owner
Home Financials are based on the most recent Mortgage that was taken out on this home.
Original Mortgage
$136,650
Outstanding Balance
$77,267
Interest Rate
3.65%
Mortgage Type
New Conventional
Estimated Equity
$415,933
Purchase Details
Closed on
Mar 6, 2009
Sold by
Brown Kim C and Jeanette Brown A
Bought by
Brown Kim C and Brown Jeanette A
Home Financials for this Owner
Home Financials are based on the most recent Mortgage that was taken out on this home.
Original Mortgage
$146,250
Interest Rate
5.03%
Mortgage Type
New Conventional
Purchase Details
Closed on
Jul 23, 2004
Sold by
Sheldon Steven A and Sheldon Deborah J
Bought by
Brown Kim C and Brown Jeanette A
Home Financials for this Owner
Home Financials are based on the most recent Mortgage that was taken out on this home.
Original Mortgage
$140,000
Interest Rate
6.27%
Mortgage Type
Commercial
Create a Home Valuation Report for This Property
The Home Valuation Report is an in-depth analysis detailing your home's value as well as a comparison with similar homes in the area
Home Values in the Area
Average Home Value in this Area
Purchase History
| Date | Buyer | Sale Price | Title Company |
|---|---|---|---|
| Brown Kim C | -- | Worldwide Recording Inc | |
| Brown Kim C | -- | Driggs Title Agency | |
| Brown Kim C | $185,000 | Fidelity National Title |
Source: Public Records
Mortgage History
| Date | Status | Borrower | Loan Amount |
|---|---|---|---|
| Open | Brown Kim C | $136,650 | |
| Closed | Brown Kim C | $146,250 | |
| Closed | Brown Kim C | $140,000 |
Source: Public Records
Tax History
| Year | Tax Paid | Tax Assessment Tax Assessment Total Assessment is a certain percentage of the fair market value that is determined by local assessors to be the total taxable value of land and additions on the property. | Land | Improvement |
|---|---|---|---|---|
| 2025 | $1,481 | $17,836 | -- | -- |
| 2024 | $1,497 | $16,986 | -- | -- |
| 2023 | $1,497 | $35,130 | $7,020 | $28,110 |
| 2022 | $1,465 | $26,750 | $5,350 | $21,400 |
| 2021 | $1,505 | $24,670 | $4,930 | $19,740 |
| 2020 | $1,485 | $23,230 | $4,640 | $18,590 |
| 2019 | $1,375 | $21,070 | $4,210 | $16,860 |
| 2018 | $1,313 | $19,030 | $3,800 | $15,230 |
| 2017 | $1,272 | $17,910 | $3,580 | $14,330 |
| 2016 | $1,249 | $16,870 | $3,370 | $13,500 |
| 2015 | $1,179 | $15,400 | $3,080 | $12,320 |
Source: Public Records
Map
Nearby Homes
- 715 N Gilbert Rd
- 2041 E Des Moines St
- 655 N Gentry Cir
- 2062 E Downing St
- 505 N Williams
- 823 N Hill Cir
- 748 N 22nd St
- 2214 E Contessa Cir
- 1629 E University Dr
- 1550 E University Dr Unit L1,2,3
- 1600 E University Dr Unit 1626
- 1712 E Fairfield St
- 2267 E Caballero Cir
- 2301 E Enrose St
- 323 N Hunt Dr E
- 2059 E Brown Rd Unit 30
- 2322 E Evergreen St
- 1505 E 3rd Place
- 220 N 22nd Place Unit 1011
- 220 N 22nd Place Unit 1094
- 1902 E Des Moines St
- 1857 E Dartmouth St
- 1901 E Dartmouth St
- 1901 E Dartmouth St
- 1859 E Des Moines St
- 646 N Kachina Unit <--WOW
- 646 N Kachina
- 652 N Kachina
- 1903 E Des Moines St
- 1910 E Des Moines St
- 638 N Kachina
- 638 S Kachina
- 660 N Kachina
- 660 S Kachina
- 1909 E Dartmouth St
- 1911 E Des Moines St
- 630 N Kachina
- 707 N Kachina
- 1856 E Decatur St
- 706 N Kachina
Your Personal Tour Guide
Ask me questions while you tour the home.