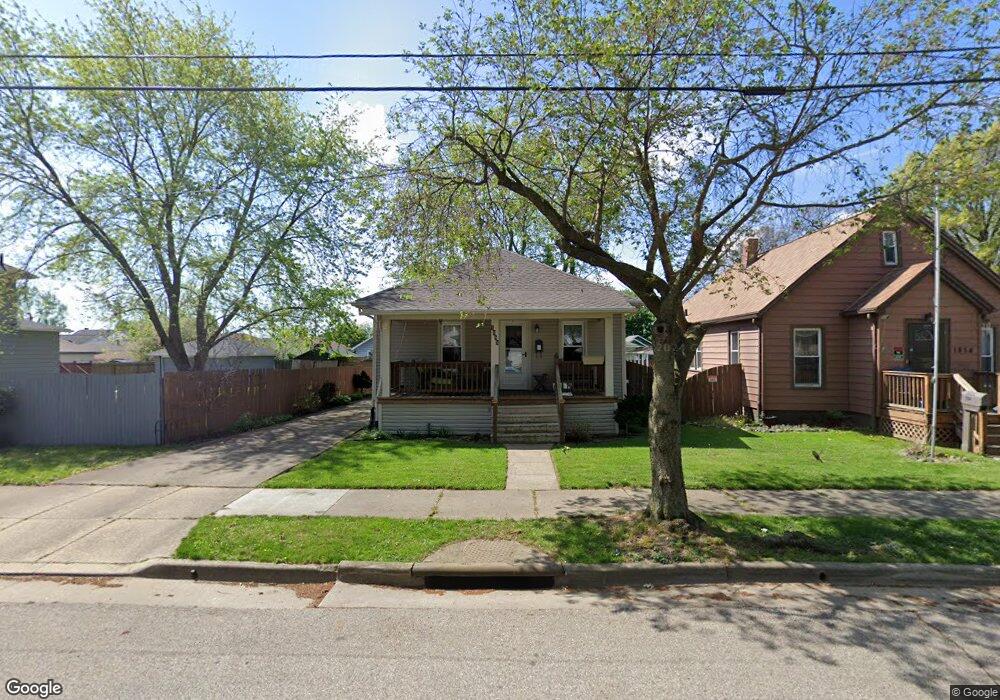
1858 Flint Ave Akron, OH 44305
Goodyear Heights NeighborhoodEstimated Value: $82,000 - $102,580
2
Beds
1
Bath
792
Sq Ft
$115/Sq Ft
Est. Value
About This Home
This home is located at 1858 Flint Ave, Akron, OH 44305 and is currently estimated at $90,895, approximately $114 per square foot. 1858 Flint Ave is a home located in Summit County with nearby schools including Seiberling Community Learning Center, Akron Preparatory school, and Middlebury Academy.
Ownership History
Date
Name
Owned For
Owner Type
Purchase Details
Closed on
Aug 11, 2006
Sold by
Citimortgage Inc
Bought by
Vartenuk Lacy
Current Estimated Value
Home Financials for this Owner
Home Financials are based on the most recent Mortgage that was taken out on this home.
Original Mortgage
$39,100
Interest Rate
6.59%
Mortgage Type
Purchase Money Mortgage
Purchase Details
Closed on
Mar 17, 2006
Sold by
Nesline Kenneth R
Bought by
Nesline Debra J
Purchase Details
Closed on
Dec 27, 2003
Sold by
Nesline Properties Inc
Bought by
Nesline Kenneth R and Nesline Debra J
Home Financials for this Owner
Home Financials are based on the most recent Mortgage that was taken out on this home.
Original Mortgage
$67,200
Interest Rate
4.25%
Mortgage Type
Purchase Money Mortgage
Purchase Details
Closed on
Apr 30, 2003
Sold by
Kidd Thomas and Kidd Rebecca
Bought by
Nesline Properties Inc
Purchase Details
Closed on
Dec 22, 1998
Sold by
Walters Donna and Helmick Donna
Bought by
Kidd Thomas A and Kidd Rebecca D
Purchase Details
Closed on
Jan 21, 1997
Sold by
Helmick Donna L
Bought by
Kidd Thomas and Kidd Rebecca
Create a Home Valuation Report for This Property
The Home Valuation Report is an in-depth analysis detailing your home's value as well as a comparison with similar homes in the area
Home Values in the Area
Average Home Value in this Area
Purchase History
| Date | Buyer | Sale Price | Title Company |
|---|---|---|---|
| Vartenuk Lacy | $48,900 | Accutitle Agency Inc | |
| Nesline Debra J | -- | None Available | |
| Nesline Kenneth R | $67,200 | Midland Commerce Group | |
| Nesline Properties Inc | $49,841 | Midland Commerce Group | |
| Kidd Thomas A | -- | Trident Title Agency | |
| Kidd Thomas | $22,584 | -- |
Source: Public Records
Mortgage History
| Date | Status | Borrower | Loan Amount |
|---|---|---|---|
| Previous Owner | Vartenuk Lacy | $39,100 | |
| Previous Owner | Nesline Kenneth R | $67,200 |
Source: Public Records
Tax History Compared to Growth
Tax History
| Year | Tax Paid | Tax Assessment Tax Assessment Total Assessment is a certain percentage of the fair market value that is determined by local assessors to be the total taxable value of land and additions on the property. | Land | Improvement |
|---|---|---|---|---|
| 2025 | $1,398 | $25,820 | $6,759 | $19,061 |
| 2024 | $1,398 | $25,820 | $6,759 | $19,061 |
| 2023 | $1,398 | $25,820 | $6,759 | $19,061 |
| 2022 | $1,249 | $18,005 | $4,568 | $13,437 |
| 2021 | $1,250 | $18,005 | $4,568 | $13,437 |
| 2020 | $1,232 | $18,010 | $4,570 | $13,440 |
| 2019 | $1,274 | $16,960 | $4,760 | $12,200 |
| 2018 | $1,258 | $16,960 | $4,760 | $12,200 |
| 2017 | $1,277 | $16,960 | $4,760 | $12,200 |
| 2016 | $1,278 | $16,960 | $4,760 | $12,200 |
| 2015 | $1,277 | $16,960 | $4,760 | $12,200 |
| 2014 | $1,267 | $16,960 | $4,760 | $12,200 |
| 2013 | $1,171 | $15,950 | $4,760 | $11,190 |
Source: Public Records
Map
Nearby Homes
- 1874 Adelaide Blvd
- 1818 Flint Ave
- 1826 Ford Ave
- 1837 Marks Ave
- 1769 Flint Ave
- 1947 Preston Ave Unit 1949
- 1955 Preston Ave Unit 1957
- 1726 Shaw Ave
- 1792 Malasia Rd
- 1892 Malasia Rd
- 248 Malacca St
- 1551 Preston Ave
- 249 Malacca St
- 1508 Malasia Rd
- 57 Carlton Dr
- 1483 Preston Ave
- 1598 Pilgrim St
- 333 Cluster Ave
- 159 Dellenberger Ave
- 1796 Newton St
- 1854 Flint Ave
- 1866 Flint Ave
- 1857 Ford Ave
- 1846 Flint Ave
- 1870 Flint Ave
- 1853 Ford Ave
- 1863 Ford Ave
- 1865 Ford Ave
- 1842 Flint Ave
- 1857 Flint Ave
- 1874 Flint Ave
- 1855 Flint Ave
- 1861 Flint Ave
- 1869 Ford Ave
- 1849 1851 Flint Ave
- 1849 Flint Ave Unit 1851
- 1865 Flint Ave
- 1845 Ford Ave
- 1838 Flint Ave
- 1845 Flint Ave