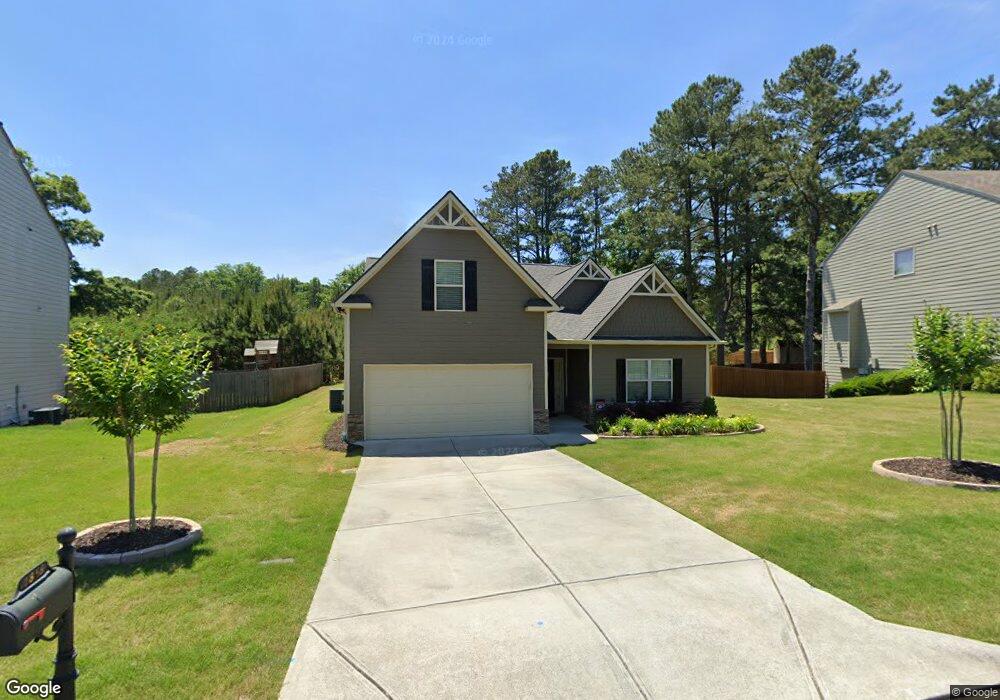
1858 Ruby Mountain St Unit 39 Powder Springs, GA 30127
West Cobb NeighborhoodEstimated Value: $401,566 - $485,000
4
Beds
2
Baths
2,125
Sq Ft
$207/Sq Ft
Est. Value
About This Home
This home is located at 1858 Ruby Mountain St Unit 39, Powder Springs, GA 30127 and is currently estimated at $439,392, approximately $206 per square foot. 1858 Ruby Mountain St Unit 39 is a home located in Cobb County with nearby schools including Tapp Middle School, McEachern High School, and Midway Covenant Christian School.
Ownership History
Date
Name
Owned For
Owner Type
Purchase Details
Closed on
Sep 27, 2019
Sold by
Opendoor Property C Llc
Bought by
Metts Kipprick L and Metts Beverly W
Current Estimated Value
Home Financials for this Owner
Home Financials are based on the most recent Mortgage that was taken out on this home.
Original Mortgage
$131,000
Outstanding Balance
$114,509
Interest Rate
3.5%
Mortgage Type
New Conventional
Estimated Equity
$324,883
Purchase Details
Closed on
May 24, 2019
Sold by
Zauner Hayley
Bought by
Opendoor Property C Llc
Purchase Details
Closed on
Sep 19, 2017
Sold by
Mcmillan Tommie L
Bought by
Zauner Hayley Johnson and Zauner Nicholas P
Home Financials for this Owner
Home Financials are based on the most recent Mortgage that was taken out on this home.
Original Mortgage
$223,150
Interest Rate
3.86%
Mortgage Type
New Conventional
Purchase Details
Closed on
Dec 30, 2011
Sold by
Piedmont Residential Llc
Bought by
Mcmillan Tommie L
Create a Home Valuation Report for This Property
The Home Valuation Report is an in-depth analysis detailing your home's value as well as a comparison with similar homes in the area
Home Values in the Area
Average Home Value in this Area
Purchase History
| Date | Buyer | Sale Price | Title Company |
|---|---|---|---|
| Metts Kipprick L | $261,000 | -- | |
| Opendoor Property C Llc | $267,400 | -- | |
| Zauner Hayley Johnson | $234,900 | -- | |
| Mcmillan Tommie L | $175,600 | -- |
Source: Public Records
Mortgage History
| Date | Status | Borrower | Loan Amount |
|---|---|---|---|
| Open | Metts Kipprick L | $131,000 | |
| Previous Owner | Zauner Hayley Johnson | $223,150 |
Source: Public Records
Tax History Compared to Growth
Tax History
| Year | Tax Paid | Tax Assessment Tax Assessment Total Assessment is a certain percentage of the fair market value that is determined by local assessors to be the total taxable value of land and additions on the property. | Land | Improvement |
|---|---|---|---|---|
| 2025 | $4,505 | $149,532 | $28,000 | $121,532 |
| 2024 | $4,508 | $149,532 | $28,000 | $121,532 |
| 2023 | $3,859 | $127,980 | $28,000 | $99,980 |
| 2022 | $3,884 | $127,980 | $28,000 | $99,980 |
| 2021 | $3,108 | $102,408 | $22,000 | $80,408 |
| 2020 | $3,108 | $102,408 | $22,000 | $80,408 |
| 2019 | $2,780 | $91,600 | $22,000 | $69,600 |
| 2018 | $2,780 | $91,600 | $22,000 | $69,600 |
| 2017 | $683 | $91,600 | $22,000 | $69,600 |
| 2016 | $649 | $79,848 | $22,000 | $57,848 |
| 2015 | $663 | $70,240 | $24,000 | $46,240 |
| 2014 | $678 | $70,240 | $0 | $0 |
Source: Public Records
Map
Nearby Homes
- 4440 Spring Mtn Ln
- 4458 Spring Mtn Ln
- 1830 Lost Mountain Rd
- 4643 Melody Ct
- 1888 Rainbow Ln
- 1985 Whitman Dr
- 1827 Lost Mountain Rd
- 1960 Lost Mountain Rd
- 2020 Youngstown Place
- 2015 Augustine Trace
- 1858 Skylark Crossing
- 4286 Gaydon Rd
- 4394 Gaydon Rd
- 1896 Bullard Rd
- 4287 Gaydon Rd
- 2337 Old Lost Mountain Rd
- 1526 Lost Mountain Rd
- 4696 Cooling Water Cir
- 2155 Overland Way
- 4545 Gaydon Rd
- 1858 Ruby Mtn St
- 1858 Ruby Mtn St Unit 39
- 1858 Ruby Mountain St
- 1862 Ruby Mtn St
- 1854 Ruby Mtn St
- 1866 Ruby Mtn St
- 1866 Ruby Mountain St Unit 37
- 1866 Ruby Mountain St
- 1850 Ruby Mountain St
- 1850 Ruby Mtn St
- 1859 Ruby Mtn St
- 1863 Ruby Mountain Unit 9
- 4447 Spring Mtn Ln
- 4471 Spring Mtn Ln
- 4471 Spring Mountain Ln
- 1863 Ruby Mtn St
- 1851 Ruby Mountain St SW Unit 7
- 1851 Ruby Mountain St SW
- 1851 Ruby Mtn St
- 1851 Ruby Mountain Ln Unit 7