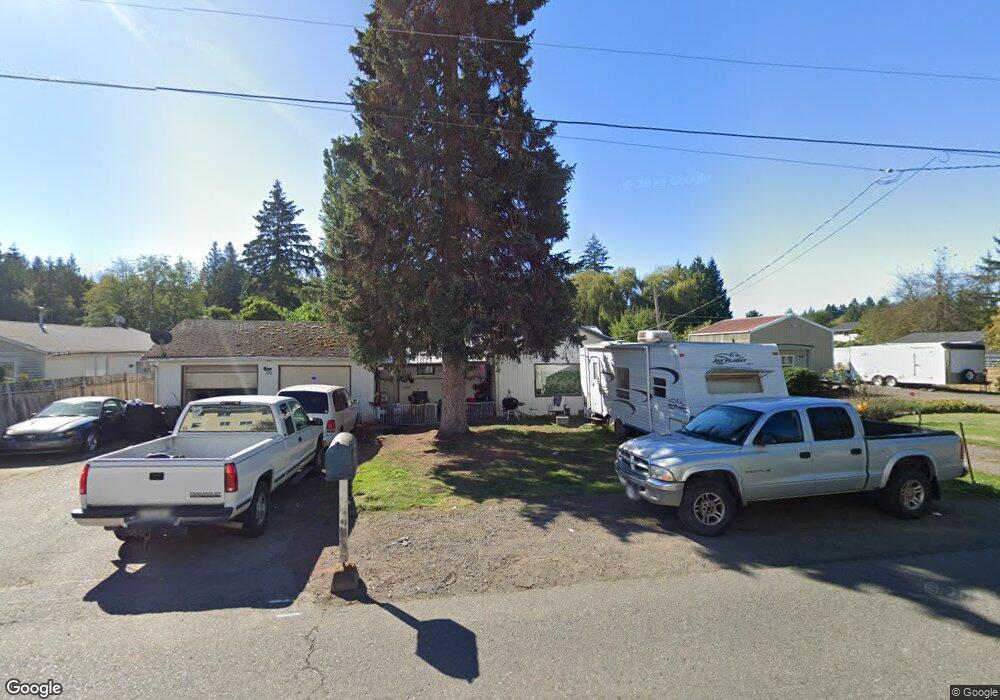
1858 SE Salmonberry Rd Port Orchard, WA 98366
Estimated Value: $339,000 - $418,440
3
Beds
1
Bath
1,104
Sq Ft
$335/Sq Ft
Est. Value
About This Home
This home is located at 1858 SE Salmonberry Rd, Port Orchard, WA 98366 and is currently estimated at $369,610, approximately $334 per square foot. 1858 SE Salmonberry Rd is a home located in Kitsap County with nearby schools including Hidden Creek Elementary School, Marcus Whitman Middle School, and South Kitsap High School.
Ownership History
Date
Name
Owned For
Owner Type
Purchase Details
Closed on
Dec 16, 2024
Sold by
Davis Hiram L
Bought by
Wilson Donald E and Sonneson Howard
Current Estimated Value
Purchase Details
Closed on
May 25, 2021
Sold by
Davis Jeannie L
Bought by
Davis Hiram L
Purchase Details
Closed on
Oct 24, 2008
Sold by
Parkins David
Bought by
Davis Hiram L and Davis Jeannie L
Home Financials for this Owner
Home Financials are based on the most recent Mortgage that was taken out on this home.
Original Mortgage
$148,046
Interest Rate
5.9%
Mortgage Type
FHA
Purchase Details
Closed on
Jun 5, 1997
Sold by
Lahti Kathleen N
Bought by
Hagen Glenn E
Home Financials for this Owner
Home Financials are based on the most recent Mortgage that was taken out on this home.
Original Mortgage
$54,000
Interest Rate
8.08%
Create a Home Valuation Report for This Property
The Home Valuation Report is an in-depth analysis detailing your home's value as well as a comparison with similar homes in the area
Home Values in the Area
Average Home Value in this Area
Purchase History
| Date | Buyer | Sale Price | Title Company |
|---|---|---|---|
| Wilson Donald E | $137,500 | Horizon Title Group Inc | |
| Wilson Donald E | $137,500 | Horizon Title Group Inc | |
| Davis Hiram L | -- | None Available | |
| Davis Hiram L | $150,280 | Rainier Title Co | |
| Hagen Glenn E | $69,000 | Transnation Title Insurance |
Source: Public Records
Mortgage History
| Date | Status | Borrower | Loan Amount |
|---|---|---|---|
| Previous Owner | Davis Hiram L | $148,046 | |
| Previous Owner | Hagen Glenn E | $54,000 |
Source: Public Records
Tax History Compared to Growth
Tax History
| Year | Tax Paid | Tax Assessment Tax Assessment Total Assessment is a certain percentage of the fair market value that is determined by local assessors to be the total taxable value of land and additions on the property. | Land | Improvement |
|---|---|---|---|---|
| 2026 | $2,671 | $334,730 | $101,000 | $233,730 |
| 2025 | $2,671 | $306,040 | $82,980 | $223,060 |
| 2024 | $2,578 | $306,040 | $82,980 | $223,060 |
| 2023 | $2,576 | $306,040 | $82,980 | $223,060 |
| 2022 | $2,579 | $257,890 | $77,500 | $180,390 |
| 2021 | $2,319 | $219,800 | $72,010 | $147,790 |
| 2020 | $2,290 | $210,470 | $68,580 | $141,890 |
| 2019 | $1,744 | $175,430 | $67,480 | $107,950 |
| 2018 | $1,896 | $151,480 | $67,480 | $84,000 |
| 2017 | $1,661 | $151,480 | $67,480 | $84,000 |
| 2016 | $1,662 | $140,390 | $67,480 | $72,910 |
| 2015 | $1,615 | $138,630 | $67,480 | $71,150 |
| 2014 | -- | $136,880 | $67,480 | $69,400 |
| 2013 | -- | $143,930 | $71,030 | $72,900 |
Source: Public Records
Map
Nearby Homes
- 1743 SE Crawford Rd
- 3922 Bethel Rd SE
- 1612 SE Sylvis Ln
- 2225 SE Kelby Cir
- 4278 Acacia Ln SE
- 1116 Koda Cir SE
- 1285 Koda Cir SE
- 2198 SE Galeel Ct
- 2315 SE Kelby Cir
- 907 Bunting Place SE
- 2360 SE Plymouth Way
- 4777 Okanogan Dr SE
- 1164 Koda Cir SE
- 902 Bunting Place SE Unit 84
- 4207 Nettle Dr SE
- 3132 Harris Rd SE
- 4471 Bristol Ln SE
- 4505 Bristol Ln SE
- 1330 SE Casandra Loop
- 0 SE Sedgwick Rd Unit NWM2362855
- 1880 SE Salmonberry Rd
- 1804 SE Salmonberry Rd
- 3982 Thimbleberry Place SE
- 3990 Thimbleberry Place SE Unit 1B
- 1776 SE Salmonberry Rd
- 1906 SE Salmonberry Rd
- 3984 Thimbleberry Place SE Unit 1C
- 1805 SE Salmonberry Rd
- 1746 SE Salmonberry Rd
- 3976 Thimbleberry Place SE
- 3974 Thimbleberry Place SE Unit 2B
- 3974 Thimbleberry Place SE
- 3968 Thimbleverry Place SE
- 3968 Thimbleberry Place SE
- 3968 Thimbleberry Place SE Unit 2B
- 3966 Thimbleberry Place SE
- 3966 Thimbleberry Place SE Unit 2D
- 1793 SE Crawford Rd
- 1932 SE Salmonberry Rd
- 1720 SE Salmonberry Rd