18582 Coshocton Rd Mount Vernon, OH 43050
Estimated Value: $295,000 - $521,195
3
Beds
4
Baths
1,722
Sq Ft
$237/Sq Ft
Est. Value
About This Home
This home is located at 18582 Coshocton Rd, Mount Vernon, OH 43050 and is currently estimated at $407,549, approximately $236 per square foot. 18582 Coshocton Rd is a home located in Knox County with nearby schools including Mount Vernon High School, St. Vincent de Paul School, and Christian Star Academy.
Ownership History
Date
Name
Owned For
Owner Type
Purchase Details
Closed on
Dec 9, 2016
Sold by
Treen Bryan Lee and Treen Daleen Marie Kleiner
Bought by
Treen Bryan Lee and Treen Daleen Marie Kleiner
Current Estimated Value
Purchase Details
Closed on
Jan 19, 2006
Sold by
Treen Anissa A
Bought by
Treen Bryan L
Home Financials for this Owner
Home Financials are based on the most recent Mortgage that was taken out on this home.
Original Mortgage
$192,000
Outstanding Balance
$109,128
Interest Rate
6.46%
Mortgage Type
Future Advance Clause Open End Mortgage
Estimated Equity
$298,421
Purchase Details
Closed on
Dec 20, 2004
Sold by
Brown Brown E E and Brown Linda M
Bought by
Treen Bryan L and Treen Anissa A
Purchase Details
Closed on
Nov 1, 1991
Sold by
Hull Shirley K
Bought by
Brown Brown E and Brown Linda M
Purchase Details
Closed on
Mar 21, 1991
Sold by
Hull Shirley K and Hull Harry
Bought by
Hull Shirley K
Create a Home Valuation Report for This Property
The Home Valuation Report is an in-depth analysis detailing your home's value as well as a comparison with similar homes in the area
Home Values in the Area
Average Home Value in this Area
Purchase History
| Date | Buyer | Sale Price | Title Company |
|---|---|---|---|
| Treen Bryan Lee | -- | None Available | |
| Treen Bryan L | -- | None Available | |
| Treen Bryan L | $205,000 | -- | |
| Brown Brown E | $92,000 | -- | |
| Hull Shirley K | -- | -- |
Source: Public Records
Mortgage History
| Date | Status | Borrower | Loan Amount |
|---|---|---|---|
| Open | Treen Bryan L | $192,000 |
Source: Public Records
Tax History Compared to Growth
Tax History
| Year | Tax Paid | Tax Assessment Tax Assessment Total Assessment is a certain percentage of the fair market value that is determined by local assessors to be the total taxable value of land and additions on the property. | Land | Improvement |
|---|---|---|---|---|
| 2024 | $5,723 | $133,380 | $45,730 | $87,650 |
| 2023 | $5,723 | $133,380 | $45,730 | $87,650 |
| 2022 | $3,508 | $91,990 | $31,540 | $60,450 |
| 2021 | $3,508 | $75,590 | $31,540 | $44,050 |
| 2020 | $3,423 | $75,590 | $31,540 | $44,050 |
| 2019 | $3,028 | $62,070 | $26,550 | $35,520 |
| 2018 | $3,029 | $62,070 | $26,550 | $35,520 |
| 2017 | $2,981 | $62,070 | $26,550 | $35,520 |
| 2016 | $2,822 | $57,310 | $24,580 | $32,730 |
| 2015 | $2,793 | $56,510 | $24,580 | $31,930 |
| 2014 | $2,806 | $56,510 | $24,580 | $31,930 |
| 2013 | $2,887 | $56,420 | $22,740 | $33,680 |
Source: Public Records
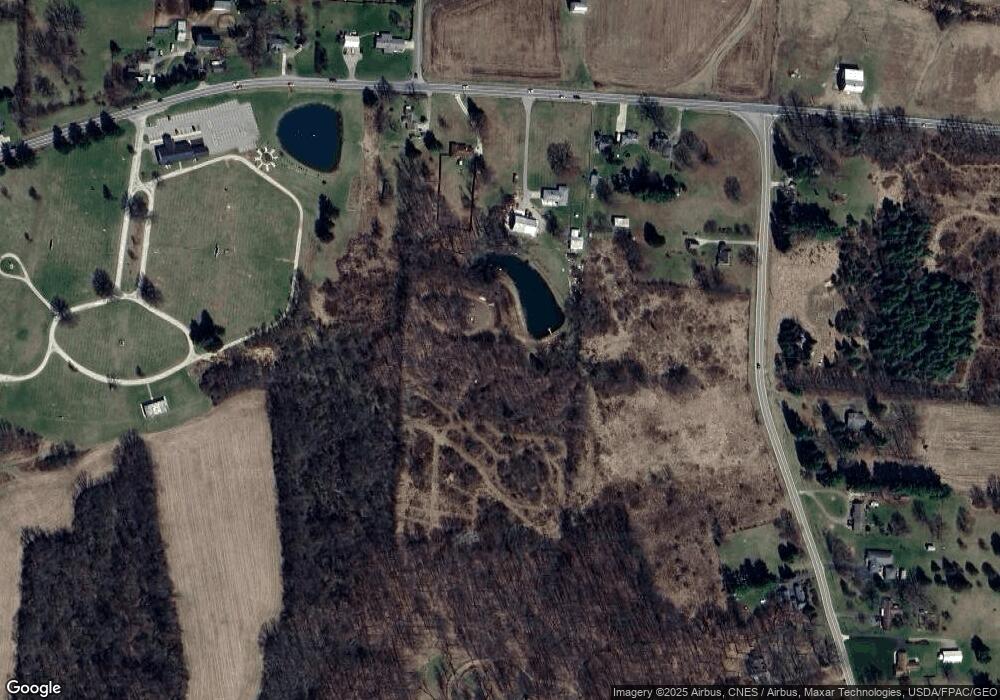
Map
Nearby Homes
- 11791 McManis Rd
- 12627 Upper Gilchrist Rd
- 104 Colonial Woods Dr Unit 4
- 117 Colonial Woods Dr
- 188 Plymouth Rd
- 17421 Coshocton Rd
- 13618 Gilchrist Rd
- 0 Venture Dr Unit 20240369
- 84 Woodlake Trail
- 42 Wildwood Ln
- 0 Wildwood Ln
- 14021 Gilchrist Rd
- 20561 Canada Rd
- 55 Wildwood Ln
- 60 Wildwood Ln
- 17375 Gambier Rd
- 2 Coventry Ct W
- 2 Coventry Ct
- 17 Upland Terrace
- 20090 New Gambier Rd
- 18618 Coshocton Rd
- 18628 Coshocton Rd
- 18542 Coshocton Rd
- 18640 Coshocton Rd
- 12141 Kenyon Rd
- 18512 Coshocton Rd
- 18509 Coshocton Rd
- 12251 Gilchrist Rd
- 18720 Coshocton Ave
- 12263 Gilchrist Rd
- 18745 Coshocton Rd
- 18441 Coshocton Rd
- 18413 Coshocton Rd
- 12040 Kenyon Rd
- 18359 Coshocton Rd
- 11988 Kenyon Rd
- 11957 Kenyon Rd
- 11968 Kenyon Rd
- 11925 Kenyon Rd
- 18873 Coshocton Rd