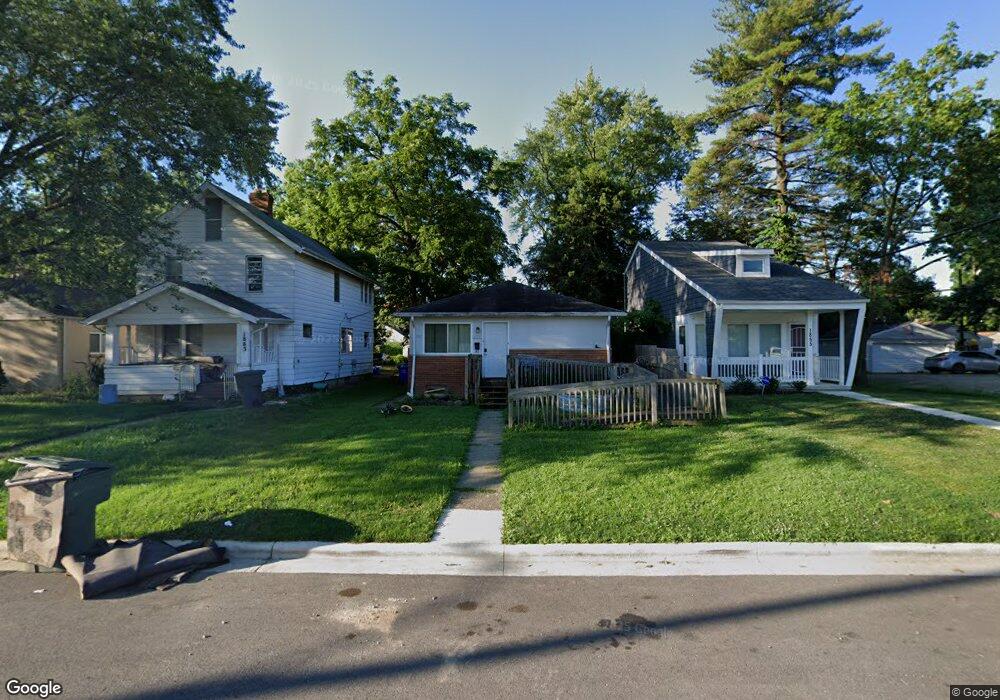
1859-1861 Agler Rd Columbus, OH 43224
North Linden NeighborhoodEstimated Value: $141,000 - $184,000
4
Beds
2
Baths
1,344
Sq Ft
$121/Sq Ft
Est. Value
About This Home
This home is located at 1859-1861 Agler Rd, Columbus, OH 43224 and is currently estimated at $162,764, approximately $121 per square foot. 1859-1861 Agler Rd is a home located in Franklin County with nearby schools including Linden STEM Academy (K-6), Linden-Mckinley Stem School On Arcadia, and Focus Learning Academy of Central Columbus.
Ownership History
Date
Name
Owned For
Owner Type
Purchase Details
Closed on
Jul 20, 2016
Sold by
Aspen Investment Group Ltd
Bought by
Maacc Properties Llc
Current Estimated Value
Home Financials for this Owner
Home Financials are based on the most recent Mortgage that was taken out on this home.
Original Mortgage
$47,950
Outstanding Balance
$4,678
Interest Rate
3.56%
Mortgage Type
Commercial
Estimated Equity
$158,086
Purchase Details
Closed on
May 14, 2015
Sold by
Harbin Bruce A and Harbin Vicki M
Bought by
Aspen Investment Group Ltd
Purchase Details
Closed on
Oct 22, 2009
Sold by
Hatter Richard and Hatter Marta Y
Bought by
Harbin Bruce A and Harbin Vickie M
Purchase Details
Closed on
Dec 18, 2008
Sold by
Fannie Mae
Bought by
Hatter Richard
Purchase Details
Closed on
Jul 8, 2008
Sold by
Niemann Linda K and Niemann Linda
Bought by
Federal National Mortgage Association
Purchase Details
Closed on
Dec 21, 1990
Purchase Details
Closed on
Oct 1, 1983
Create a Home Valuation Report for This Property
The Home Valuation Report is an in-depth analysis detailing your home's value as well as a comparison with similar homes in the area
Home Values in the Area
Average Home Value in this Area
Purchase History
| Date | Buyer | Sale Price | Title Company |
|---|---|---|---|
| Maacc Properties Llc | $59,000 | Monarch Title Services Llc | |
| Aspen Investment Group Ltd | $34,500 | Arrow Title | |
| Harbin Bruce A | $60,000 | Signature | |
| Hatter Richard | $21,500 | Title First | |
| Federal National Mortgage Association | -- | None Available | |
| -- | -- | -- | |
| -- | $150,000 | -- |
Source: Public Records
Mortgage History
| Date | Status | Borrower | Loan Amount |
|---|---|---|---|
| Open | Maacc Properties Llc | $47,950 |
Source: Public Records
Tax History Compared to Growth
Tax History
| Year | Tax Paid | Tax Assessment Tax Assessment Total Assessment is a certain percentage of the fair market value that is determined by local assessors to be the total taxable value of land and additions on the property. | Land | Improvement |
|---|---|---|---|---|
| 2024 | $2,055 | $44,840 | $9,520 | $35,320 |
| 2023 | $2,179 | $44,840 | $9,520 | $35,320 |
| 2022 | $1,462 | $24,680 | $3,960 | $20,720 |
| 2021 | $1,464 | $24,680 | $3,960 | $20,720 |
| 2020 | $1,466 | $24,680 | $3,960 | $20,720 |
| 2019 | $1,470 | $21,220 | $3,960 | $17,260 |
| 2018 | $1,354 | $21,220 | $3,960 | $17,260 |
| 2017 | $1,319 | $21,220 | $3,960 | $17,260 |
| 2016 | $1,396 | $20,060 | $3,710 | $16,350 |
| 2015 | $1,241 | $20,060 | $3,710 | $16,350 |
| 2014 | $1,244 | $20,060 | $3,710 | $16,350 |
| 2013 | $722 | $23,590 | $4,375 | $19,215 |
Source: Public Records
Map
Nearby Homes
- 1853 E Lakeview Ave
- 1841 E North Broadway St
- 1940 Eddystone Ave
- 1888 E North Broadway St
- 3049 Cleveland Ave
- 2765 Joyce Ave
- 1944 E North Broadway St
- 1671 E Brighton Rd
- 2771 Fern Ave
- 1691 E Weber Rd
- 2076 Agler Rd
- 1980 Oakland Park Ave
- 3086 Bremen St
- 1669 Manchester Ave
- 1591-1593 E Weber Rd
- 1827 Aberdeen Ave
- 3058 Dresden St
- 1967 Denune Ave
- 00 Minnesota Ave
- 01 Minnesota Ave
- 1859 Agler Rd Unit 861
- 1863 Agler Rd
- 1855 Agler Rd
- 1865 Agler Rd Unit 867
- 1871 Agler Rd Unit 873
- 1877 Agler Rd
- 1856 Robert St
- 1850 Robert St
- 1862 Robert St
- 1883 Agler Rd
- 1835 Agler Rd
- 1840 Robert St
- 1866 Robert St
- 0 Robert St
- 1887 Agler Rd
- 1834 Robert St
- 1829 Agler Rd
- 1874 Robert St
- 1828 Robert St
- 1880 Robert St