Estimated Value: $200,000 - $226,000
3
Beds
2
Baths
1,315
Sq Ft
$159/Sq Ft
Est. Value
About This Home
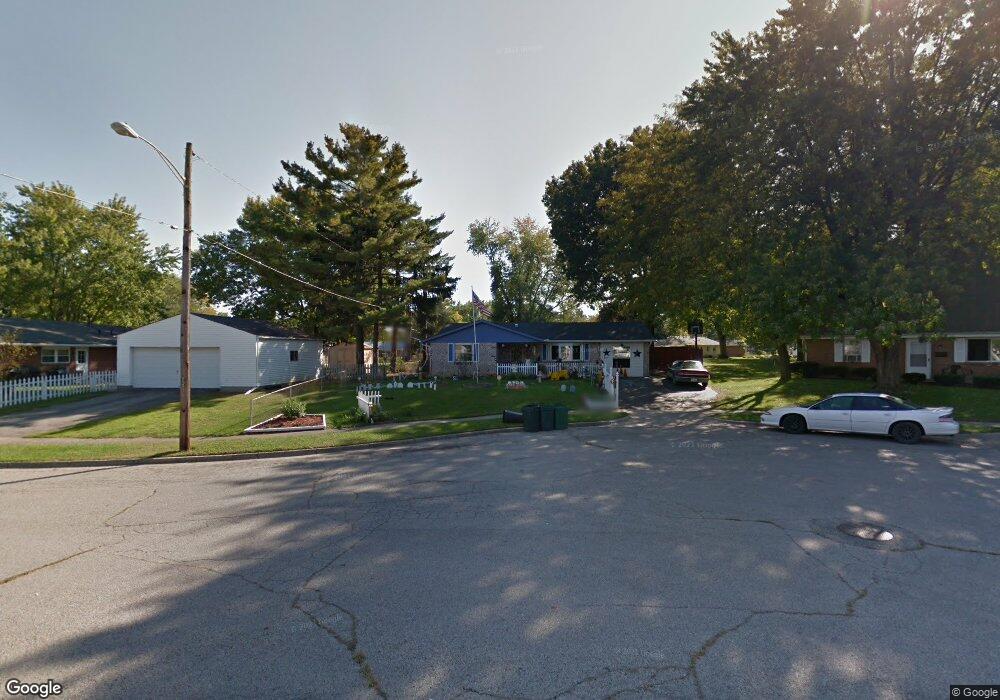
This home is located at 1859 Chippewa Ct, Xenia, OH 45385 and is currently estimated at $209,655, approximately $159 per square foot. 1859 Chippewa Ct is a home located in Greene County with nearby schools including Xenia High School, Summit Academy Community School for Alternative Learners - Xenia, and Legacy Christian Academy.
Ownership History
Date
Name
Owned For
Owner Type
Purchase Details
Closed on
Mar 8, 1996
Sold by
Miller Brice E
Bought by
Oliver Tammy L and Oliver Smith M
Current Estimated Value
Home Financials for this Owner
Home Financials are based on the most recent Mortgage that was taken out on this home.
Original Mortgage
$62,900
Outstanding Balance
$2,472
Interest Rate
7.05%
Mortgage Type
FHA
Estimated Equity
$207,183
Create a Home Valuation Report for This Property
The Home Valuation Report is an in-depth analysis detailing your home's value as well as a comparison with similar homes in the area
Home Values in the Area
Average Home Value in this Area
Purchase History
| Date | Buyer | Sale Price | Title Company |
|---|---|---|---|
| Oliver Tammy L | $63,000 | -- |
Source: Public Records
Mortgage History
| Date | Status | Borrower | Loan Amount |
|---|---|---|---|
| Open | Oliver Tammy L | $62,900 |
Source: Public Records
Tax History Compared to Growth
Tax History
| Year | Tax Paid | Tax Assessment Tax Assessment Total Assessment is a certain percentage of the fair market value that is determined by local assessors to be the total taxable value of land and additions on the property. | Land | Improvement |
|---|---|---|---|---|
| 2024 | $2,046 | $49,060 | $12,580 | $36,480 |
| 2023 | $2,046 | $49,060 | $12,580 | $36,480 |
| 2022 | $1,695 | $34,650 | $7,400 | $27,250 |
| 2021 | $1,718 | $34,650 | $7,400 | $27,250 |
| 2020 | $1,644 | $34,650 | $7,400 | $27,250 |
| 2019 | $1,511 | $29,970 | $7,180 | $22,790 |
| 2018 | $1,516 | $29,970 | $7,180 | $22,790 |
| 2017 | $1,398 | $29,970 | $7,180 | $22,790 |
| 2016 | $1,398 | $27,130 | $7,180 | $19,950 |
| 2015 | $1,402 | $27,130 | $7,180 | $19,950 |
| 2014 | $1,341 | $27,130 | $7,180 | $19,950 |
Source: Public Records
Map
Nearby Homes
- 1618 Navajo Dr
- 1778 Arapaho Dr
- 1653 Seneca Dr
- 1568 Cheyenne Dr
- 1769 Gayhart Dr
- 1144 Rockwell Dr
- 1272 Bellbrook Ave
- 1208 Bellbrook Ave
- 1829 Gayhart Dr
- 1866 Roxbury Dr
- 2758 Wyoming Dr
- 1908 Whitt St
- 1255 Colorado Dr
- 2142 Michigan Dr
- 1342 Kylemore Dr
- 219 Kansas Dr
- 414 Whisper Ln
- 1107 Arkansas Dr
- 2257 Maryland Dr
- 121 S Progress Dr