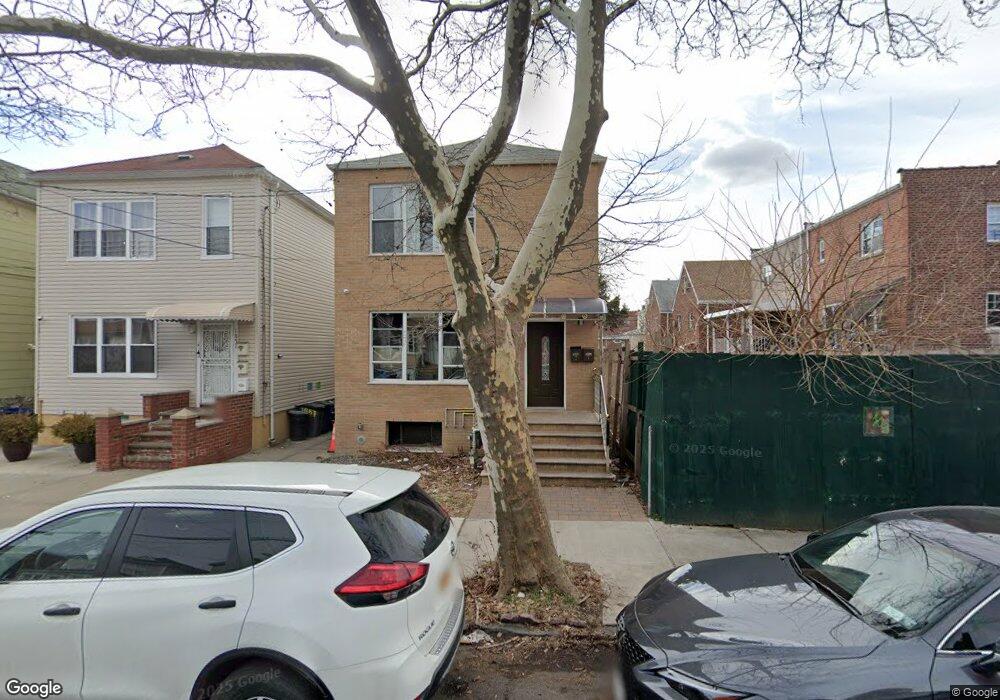
1859 Tomlinson Ave Bronx, NY 10461
Morris Park NeighborhoodEstimated Value: $731,084 - $926,000
--
Bed
--
Bath
2,120
Sq Ft
$382/Sq Ft
Est. Value
About This Home
This home is located at 1859 Tomlinson Ave, Bronx, NY 10461 and is currently estimated at $810,271, approximately $382 per square foot. 1859 Tomlinson Ave is a home located in Bronx County with nearby schools including P.S. 108 Philip J Abinanti, J.H.S. 144 Michelangelo, and Emblaze Academy Charter School.
Ownership History
Date
Name
Owned For
Owner Type
Purchase Details
Closed on
Mar 11, 2025
Sold by
1859 Tomlinson Ave Llc
Bought by
Tania Chowdhury Nusrat Farooqui
Current Estimated Value
Home Financials for this Owner
Home Financials are based on the most recent Mortgage that was taken out on this home.
Original Mortgage
$637,500
Outstanding Balance
$634,250
Interest Rate
6.89%
Mortgage Type
Purchase Money Mortgage
Estimated Equity
$176,021
Purchase Details
Closed on
Feb 22, 2021
Sold by
Iqbal Qaiser
Bought by
1859 Tomlinson Ave Llc
Purchase Details
Closed on
Dec 5, 2018
Sold by
Estate Of Mary W Kilarski and Iodice
Bought by
Iqbal Qaiser
Home Financials for this Owner
Home Financials are based on the most recent Mortgage that was taken out on this home.
Original Mortgage
$450,000
Interest Rate
4.8%
Mortgage Type
New Conventional
Create a Home Valuation Report for This Property
The Home Valuation Report is an in-depth analysis detailing your home's value as well as a comparison with similar homes in the area
Home Values in the Area
Average Home Value in this Area
Purchase History
| Date | Buyer | Sale Price | Title Company |
|---|---|---|---|
| Tania Chowdhury Nusrat Farooqui | $750,000 | -- | |
| 1859 Tomlinson Ave Llc | -- | -- | |
| Iqbal Qaiser | $600,000 | -- |
Source: Public Records
Mortgage History
| Date | Status | Borrower | Loan Amount |
|---|---|---|---|
| Open | Tania Chowdhury Nusrat Farooqui | $637,500 | |
| Previous Owner | Iqbal Qaiser | $450,000 |
Source: Public Records
Tax History Compared to Growth
Tax History
| Year | Tax Paid | Tax Assessment Tax Assessment Total Assessment is a certain percentage of the fair market value that is determined by local assessors to be the total taxable value of land and additions on the property. | Land | Improvement |
|---|---|---|---|---|
| 2025 | $8,577 | $45,116 | $7,282 | $37,834 |
| 2024 | $8,577 | $42,703 | $6,489 | $36,214 |
| 2023 | $8,120 | $40,426 | $7,006 | $33,420 |
| 2022 | $7,642 | $43,200 | $8,880 | $34,320 |
| 2021 | $8,056 | $39,840 | $8,880 | $30,960 |
| 2020 | $7,526 | $37,440 | $8,880 | $28,560 |
| 2019 | $7,018 | $36,000 | $8,880 | $27,120 |
| 2018 | $6,451 | $31,648 | $7,641 | $24,007 |
| 2017 | $6,087 | $29,859 | $7,808 | $22,051 |
| 2016 | $5,969 | $29,859 | $8,338 | $21,521 |
| 2015 | $3,397 | $29,631 | $8,709 | $20,922 |
| 2014 | $3,397 | $27,955 | $9,838 | $18,117 |
Source: Public Records
Map
Nearby Homes
- 1832 Haight Ave
- 1819 Haight Ave
- 1818 Tomlinson Ave
- 1116 Rhinelander Ave
- 1855 Williamsbridge Rd
- 1863 Williamsbridge Rd
- 1903 Tomlinson Ave
- 1846 Williamsbridge Rd
- 1859 Hone Ave
- 1917 Lurting Ave
- 1831 Paulding Ave
- 1861 Hering Ave
- 1725 Hone Ave
- 1946 Tomlinson Ave
- 1720A Paulding Ave
- 1004 Rhinelander Ave
- 1963 Hone Ave
- 1059 Neill Ave
- 1629 Haight Ave
- 1633 Lurting Ave
- 1857 Tomlinson Ave
- 1855 Tomlinson Ave
- 1114 Rhinelander Ave Unit 1bd apartment
- 1114 Rhinelander Ave
- 1112 Rhinelander Ave
- 1110 Rhinelander Ave
- 1853 Tomlinson Ave
- 1858 Haight Ave
- 1106 Rhinelander Ave
- 1851 Tomlinson Ave
- 1862 Haight Ave
- 1104 Rhinelander Ave
- 1849 Tomlinson Ave
- 1856 Haight Ave
- 1122 Rhinelander Ave
- 1854 Haight Ave
- 1870 Haight Ave
- 1847 Tomlinson Ave
- 1124 Rhinelander Ave
- 1862 Tomlinson Ave