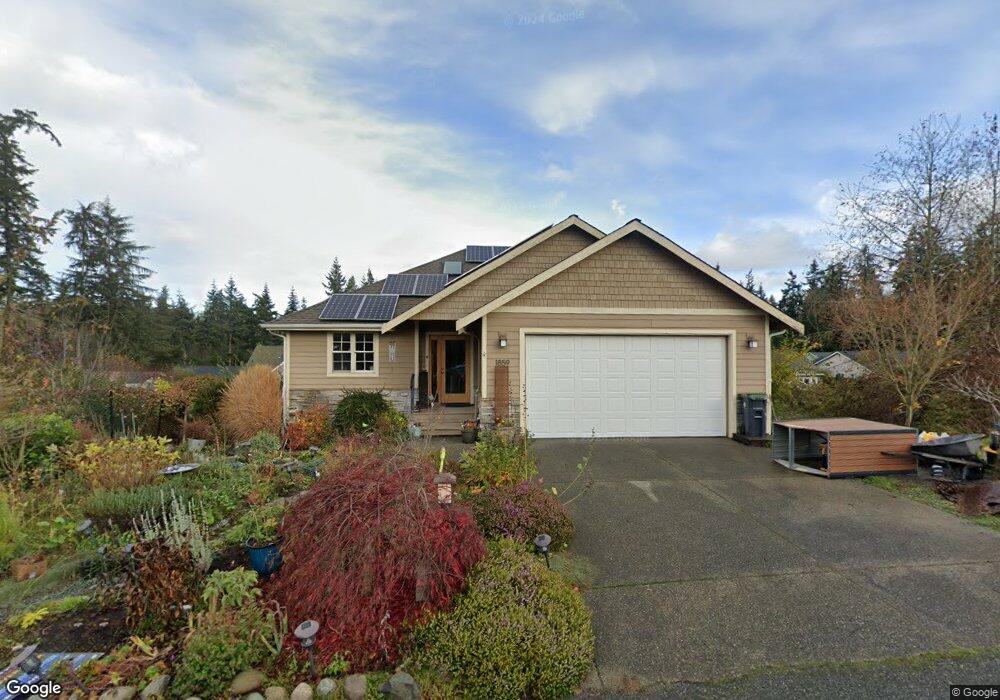
1859 Twin Oaks Ln Freeland, WA 98249
Estimated Value: $663,844 - $1,122,000
2
Beds
3
Baths
2,025
Sq Ft
$392/Sq Ft
Est. Value
About This Home
This home is located at 1859 Twin Oaks Ln, Freeland, WA 98249 and is currently estimated at $793,961, approximately $392 per square foot. 1859 Twin Oaks Ln is a home located in Island County with nearby schools including South Whidbey Elementary School, South Whidbey Middle School, and South Whidbey High School.
Ownership History
Date
Name
Owned For
Owner Type
Purchase Details
Closed on
Jan 2, 2013
Sold by
The Roth Company
Bought by
Clayton Terence B and Clayton Penelope
Current Estimated Value
Purchase Details
Closed on
Jun 16, 2011
Sold by
Roth Gary W and Roth Nanette Mckinley
Bought by
Clayton Penelope J and Clayton Terence
Home Financials for this Owner
Home Financials are based on the most recent Mortgage that was taken out on this home.
Original Mortgage
$130,000
Interest Rate
3%
Mortgage Type
Adjustable Rate Mortgage/ARM
Purchase Details
Closed on
Apr 6, 2010
Sold by
Whitney John F and Whitney Else J
Bought by
Roth Gary W and Roth Nanette Mckinley
Purchase Details
Closed on
Sep 13, 2005
Sold by
Cultus Bay Inc
Bought by
Whitney John F and Whitney Else
Create a Home Valuation Report for This Property
The Home Valuation Report is an in-depth analysis detailing your home's value as well as a comparison with similar homes in the area
Home Values in the Area
Average Home Value in this Area
Purchase History
| Date | Buyer | Sale Price | Title Company |
|---|---|---|---|
| Clayton Terence B | $14,000 | Land Title Escrow Island Co | |
| Clayton Penelope J | $289,000 | Land Title Escrow Island Co | |
| Roth Gary W | $25,000 | Land Title Escrow Island Co | |
| Whitney John F | $67,000 | Land Title Co Island Cnty |
Source: Public Records
Mortgage History
| Date | Status | Borrower | Loan Amount |
|---|---|---|---|
| Previous Owner | Clayton Penelope J | $130,000 |
Source: Public Records
Tax History Compared to Growth
Tax History
| Year | Tax Paid | Tax Assessment Tax Assessment Total Assessment is a certain percentage of the fair market value that is determined by local assessors to be the total taxable value of land and additions on the property. | Land | Improvement |
|---|---|---|---|---|
| 2024 | $3,936 | $627,109 | $230,000 | $397,109 |
| 2023 | $3,936 | $601,607 | $200,000 | $401,607 |
| 2022 | $3,670 | $576,715 | $210,000 | $366,715 |
| 2021 | $3,331 | $461,722 | $140,000 | $321,722 |
| 2020 | $2,985 | $426,416 | $115,000 | $311,416 |
| 2019 | $2,703 | $391,941 | $170,000 | $221,941 |
| 2018 | $2,843 | $352,544 | $130,000 | $222,544 |
| 2017 | $2,389 | $343,746 | $120,000 | $223,746 |
| 2016 | $2,445 | $316,151 | $90,000 | $226,151 |
| 2015 | -- | $313,558 | $85,000 | $228,558 |
| 2013 | -- | $243,786 | $52,000 | $191,786 |
Source: Public Records
Map
Nearby Homes
- 1774 Twin Oaks Ln
- 1857 Watkins Rd
- 0 XXX E Harbor Rd
- 5208 E Harbor Rd
- 0 0-xx E Harbor Rd
- 52 xx E Harbor Rd
- 1865 Crestwood Cove Ct
- 5430 Pleasant View Ln
- 1672 Dorsey Dr
- 1762 Compass Blvd Unit 17
- 1776 Compass Blvd Unit 24
- 0 Lynne Dr
- 1738 Alliance Ave Unit 14
- 1649 Stewart Rd
- 1578 Stewart Rd
- 0 XXX Osprey Rd Unit 15-2
- 0 XXX Osprey Rd (15-1 & 15-2)
- 0 XXX Osprey Rd Unit 15-1
- 5591 S Harbor Ave
- 1940 Cattail Ln
- 1823 Twin Oaks Ln
- 1888 Twin Oaks Ln
- 1849 Twin Oaks Ln
- 1860 Watkins Rd
- 1856 Watkins Dr
- 1864 Watkins Rd
- 1856 Watkins Rd
- 1873 Twin Oaks Ln
- 1868 Watkins Rd
- 1847 Twin Oaks Ln
- 1874 Watkins Rd
- 1881 Twin Oaks Ln
- 1880 Twin Oaks Ln
- 1878 Watkins Dr
- 0 Watkins Rd Unit NWM1581583
- 0 Watkins Rd
- 111 Twin Oaks
- 1111 Watkins Rd
- 1861 Watkins Rd
- 1865 Watkins Rd