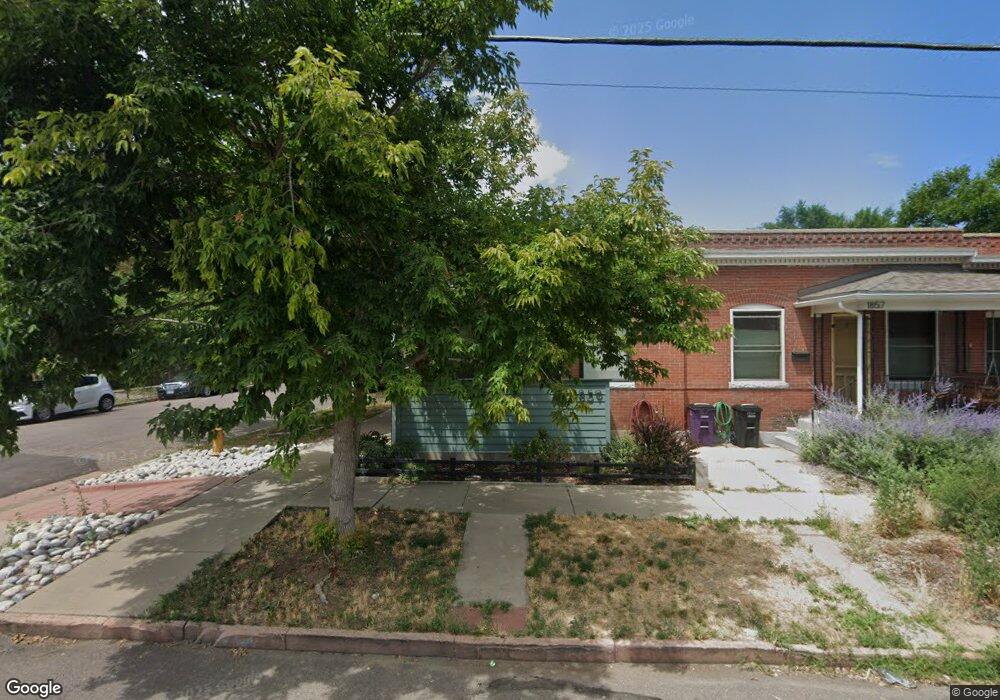
1859 W 41st Ave Denver, CO 80211
Sunnyside NeighborhoodEstimated Value: $429,000 - $500,000
1
Bed
1
Bath
846
Sq Ft
$544/Sq Ft
Est. Value
About This Home
This home is located at 1859 W 41st Ave, Denver, CO 80211 and is currently estimated at $460,512, approximately $544 per square foot. 1859 W 41st Ave is a home located in Denver County with nearby schools including Bryant Webster Dual Language School, Denver Montessori Junior/Senior High School, and Skinner Middle School.
Ownership History
Date
Name
Owned For
Owner Type
Purchase Details
Closed on
May 31, 2018
Sold by
Vanaria Richard S
Bought by
Vanaria Vanaria Richard R Richard R and Vanaria Richard R
Current Estimated Value
Purchase Details
Closed on
Jul 2, 2015
Sold by
Ramirez Jose
Bought by
Vanaria Richard
Home Financials for this Owner
Home Financials are based on the most recent Mortgage that was taken out on this home.
Original Mortgage
$166,400
Outstanding Balance
$129,930
Interest Rate
3.9%
Mortgage Type
New Conventional
Estimated Equity
$330,582
Purchase Details
Closed on
Mar 3, 2005
Sold by
Ramirez Jose and Ramirez Josefina
Bought by
Ramirez Jose
Purchase Details
Closed on
Oct 24, 1997
Sold by
Martinez Silvino Ernest and Martinez Mary Bernic
Bought by
Ramirez Jose and Ramirez Josefina
Home Financials for this Owner
Home Financials are based on the most recent Mortgage that was taken out on this home.
Original Mortgage
$22,500
Interest Rate
8%
Mortgage Type
Seller Take Back
Create a Home Valuation Report for This Property
The Home Valuation Report is an in-depth analysis detailing your home's value as well as a comparison with similar homes in the area
Home Values in the Area
Average Home Value in this Area
Purchase History
| Date | Buyer | Sale Price | Title Company |
|---|---|---|---|
| Vanaria Vanaria Richard R Richard R | -- | None Available | |
| Vanaria Richard | $208,000 | Land Title Guarantee | |
| Ramirez Jose | -- | -- | |
| Ramirez Jose | $37,500 | -- |
Source: Public Records
Mortgage History
| Date | Status | Borrower | Loan Amount |
|---|---|---|---|
| Open | Vanaria Richard | $166,400 | |
| Previous Owner | Ramirez Jose | $22,500 |
Source: Public Records
Tax History Compared to Growth
Tax History
| Year | Tax Paid | Tax Assessment Tax Assessment Total Assessment is a certain percentage of the fair market value that is determined by local assessors to be the total taxable value of land and additions on the property. | Land | Improvement |
|---|---|---|---|---|
| 2024 | $2,649 | $33,440 | $4,760 | $28,680 |
| 2023 | $2,591 | $33,440 | $4,760 | $28,680 |
| 2022 | $1,963 | $24,680 | $7,440 | $17,240 |
| 2021 | $1,963 | $25,390 | $7,660 | $17,730 |
| 2020 | $1,796 | $24,210 | $6,310 | $17,900 |
| 2019 | $1,746 | $24,210 | $6,310 | $17,900 |
| 2018 | $1,585 | $20,490 | $5,880 | $14,610 |
| 2017 | $1,580 | $20,490 | $5,880 | $14,610 |
| 2016 | $1,377 | $16,890 | $4,243 | $12,647 |
| 2015 | $1,320 | $16,890 | $4,243 | $12,647 |
| 2014 | $1,011 | $12,170 | $1,003 | $11,167 |
Source: Public Records
Map
Nearby Homes
- 1857 W 41st Ave
- 1855 W 41st Ave
- 4112 Raritan St
- 1851 W 41st Ave
- 4116 Raritan St
- 4115 Raritan St
- 4115 Raritan St
- 1849 W 41st Ave
- 4101 Raritan St
- 4120 Raritan St
- 1860 W 41st Ave
- 4121 Raritan St
- 1866 W 41st Ave
- 4111 Raritan St
- 4125 Raritan St
- 1845 W 41st Ave
- 4053 Quivas St
- 4130 Raritan St
- 4127 Raritan St
- 1847 W 41st Ave