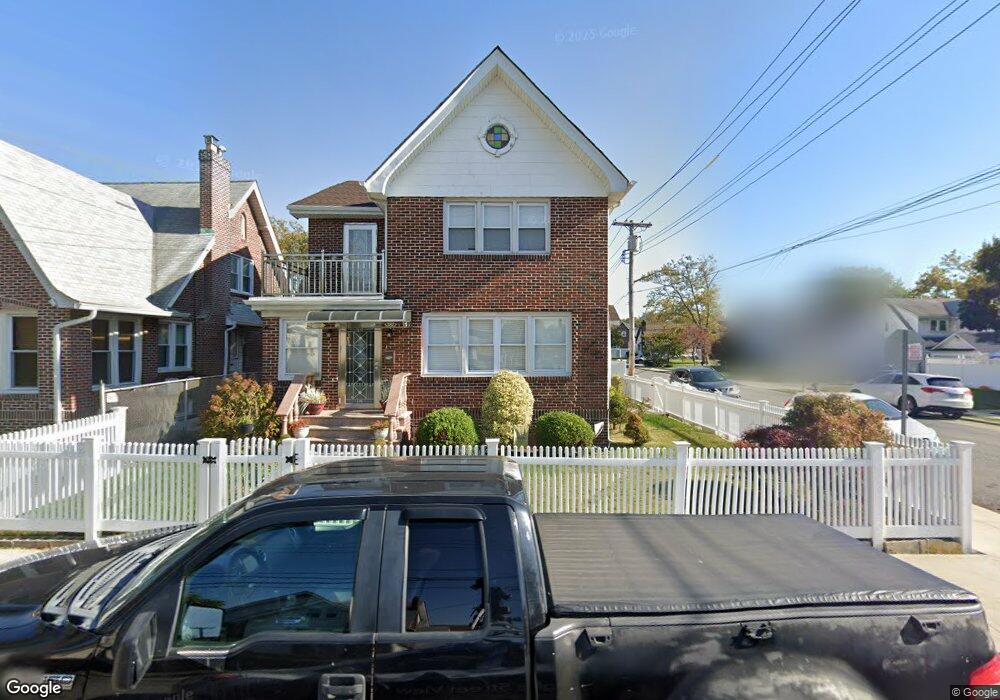
186-02 Hilburn Ave Jamaica, NY 11412
Hollis NeighborhoodEstimated Value: $830,000 - $946,000
3
Beds
2
Baths
2,221
Sq Ft
$399/Sq Ft
Est. Value
About This Home
This home is located at 186-02 Hilburn Ave, Jamaica, NY 11412 and is currently estimated at $886,732, approximately $399 per square foot. 186-02 Hilburn Ave is a home located in Queens County with nearby schools including P.S. 118 Lorraine Hansberry, I.S. 192 The Linden, and Riverton Street Charter School.
Ownership History
Date
Name
Owned For
Owner Type
Purchase Details
Closed on
Sep 25, 2015
Sold by
Jackman Sharon A and Lagier John H
Bought by
Jackman Sharon A
Current Estimated Value
Purchase Details
Closed on
Nov 19, 2009
Sold by
Ogl Inc
Bought by
Jackman Sharon A and Lagier John H
Home Financials for this Owner
Home Financials are based on the most recent Mortgage that was taken out on this home.
Original Mortgage
$415,338
Interest Rate
4.92%
Mortgage Type
Purchase Money Mortgage
Purchase Details
Closed on
Aug 11, 2008
Sold by
Aurora Loan Services
Bought by
Ogl Inc
Purchase Details
Closed on
Oct 12, 2007
Sold by
Botter Esq Referee Allan S
Bought by
Aurora Loan Services
Purchase Details
Closed on
Feb 16, 2006
Sold by
Bush Lynette and Bush Trevor
Bought by
Graves Christopher
Home Financials for this Owner
Home Financials are based on the most recent Mortgage that was taken out on this home.
Original Mortgage
$53,550
Interest Rate
6.16%
Create a Home Valuation Report for This Property
The Home Valuation Report is an in-depth analysis detailing your home's value as well as a comparison with similar homes in the area
Home Values in the Area
Average Home Value in this Area
Purchase History
| Date | Buyer | Sale Price | Title Company |
|---|---|---|---|
| Jackman Sharon A | -- | -- | |
| Jackman Sharon A | $423,000 | -- | |
| Jackman Sharon A | $423,000 | -- | |
| Ogl Inc | $250,000 | -- | |
| Ogl Inc | $250,000 | -- | |
| Aurora Loan Services | $304,129 | -- | |
| Aurora Loan Services | $304,129 | -- | |
| Graves Christopher | $357,000 | -- | |
| Graves Christopher | $357,000 | -- |
Source: Public Records
Mortgage History
| Date | Status | Borrower | Loan Amount |
|---|---|---|---|
| Previous Owner | Jackman Sharon A | $415,338 | |
| Previous Owner | Graves Christopher | $53,550 | |
| Previous Owner | Graves Christopher | $285,750 |
Source: Public Records
Tax History Compared to Growth
Tax History
| Year | Tax Paid | Tax Assessment Tax Assessment Total Assessment is a certain percentage of the fair market value that is determined by local assessors to be the total taxable value of land and additions on the property. | Land | Improvement |
|---|---|---|---|---|
| 2025 | $7,204 | $37,741 | $11,529 | $26,212 |
| 2024 | $7,204 | $35,868 | $10,290 | $25,578 |
| 2023 | $6,797 | $33,840 | $9,788 | $24,052 |
| 2022 | $6,755 | $42,360 | $14,700 | $27,660 |
| 2021 | $7,016 | $40,620 | $14,700 | $25,920 |
| 2020 | $6,657 | $34,920 | $14,700 | $20,220 |
| 2019 | $6,253 | $31,200 | $14,700 | $16,500 |
| 2018 | $5,749 | $28,200 | $12,121 | $16,079 |
| 2017 | $5,749 | $28,200 | $14,245 | $13,955 |
| 2016 | $5,553 | $28,200 | $14,245 | $13,955 |
| 2015 | $3,209 | $26,209 | $16,313 | $9,896 |
| 2014 | $3,209 | $24,909 | $14,825 | $10,084 |
Source: Public Records
Map
Nearby Homes
- 186-16 Hilburn Ave
- 183-34 Fonda Ave
- 183-29 Brinkerhoff Ave
- 187-44 Jordan Ave
- 188-07 Mangin Ave
- 18823 Mangin Ave
- 188-25 Mangin Ave
- 183-12 Elmira Ave
- 188-31 Jordan Ave
- 187-23 Brinkerhoff Ave
- 18833 Keeseville Ave
- 111-06 Farmers Blvd
- 183-09 Dunlop Ave
- 183-67 Dunlop Ave
- 11176 180th St
- 19022 111th Rd
- 10533 Farmers Blvd
- 179-07 Murdock Ave
- 111-54 178th Place
- 112- 2 178th St
- 18602 Hilburn Ave
- 18606 Hilburn Ave
- 186-10 Hilburn Ave
- 18610 Hilburn Ave
- 18703 Ilion Ave
- 18546 Hilburn Ave
- 18705 Ilion Ave
- 18705 Ilion Ave
- 11118 Mayville St
- 18616 Hilburn Ave
- 18715 Ilion Ave
- 18540 Hilburn Ave
- 18601 Hilburn Ave
- 186-09 Hilburn Ave
- 18719 Ilion Ave
- 18609 Hilburn Ave
- 18639 Ilion Ave
- 18545 Hilburn Ave
- 18536 Hilburn Ave
- 186-15 Hilburn Ave