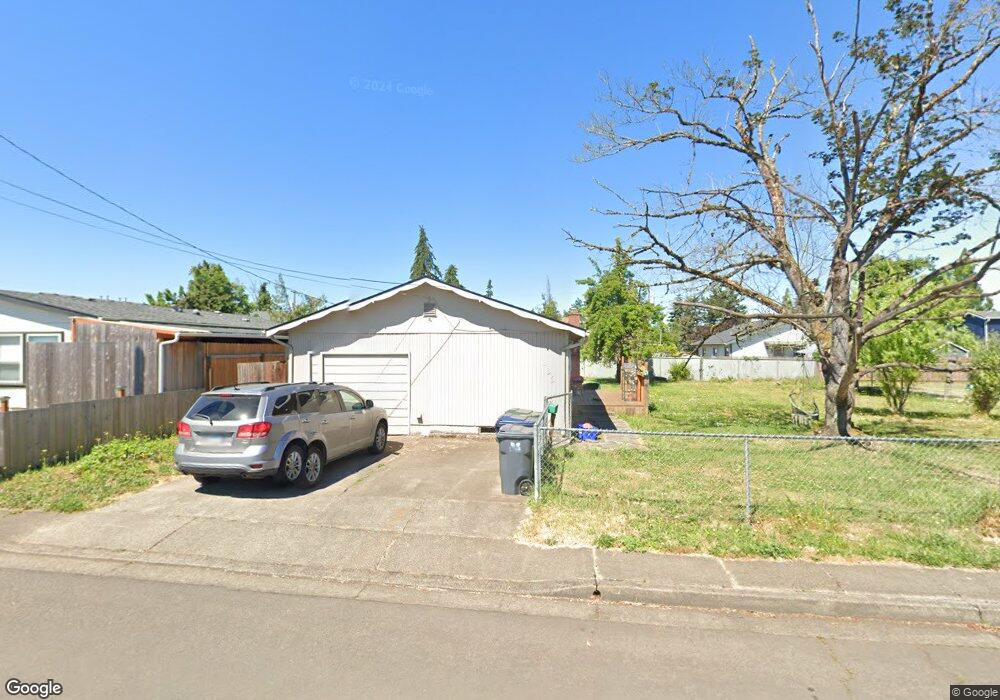
186 38th St Springfield, OR 97478
East Springfield NeighborhoodEstimated Value: $317,000 - $344,000
3
Beds
1
Bath
1,103
Sq Ft
$303/Sq Ft
Est. Value
About This Home
This home is located at 186 38th St, Springfield, OR 97478 and is currently estimated at $334,666, approximately $303 per square foot. 186 38th St is a home located in Lane County with nearby schools including Riverbend Elementary School, Briggs Middle School, and Thurston High School.
Ownership History
Date
Name
Owned For
Owner Type
Purchase Details
Closed on
Jun 18, 2015
Sold by
Garoutte Roxie
Bought by
Motsinger Derek W
Current Estimated Value
Home Financials for this Owner
Home Financials are based on the most recent Mortgage that was taken out on this home.
Original Mortgage
$127,546
Outstanding Balance
$98,930
Interest Rate
3.87%
Mortgage Type
FHA
Estimated Equity
$235,736
Purchase Details
Closed on
Jul 30, 2001
Sold by
Castleman Laura L
Bought by
Garoutte Roxie
Home Financials for this Owner
Home Financials are based on the most recent Mortgage that was taken out on this home.
Original Mortgage
$99,439
Interest Rate
7.15%
Mortgage Type
FHA
Create a Home Valuation Report for This Property
The Home Valuation Report is an in-depth analysis detailing your home's value as well as a comparison with similar homes in the area
Home Values in the Area
Average Home Value in this Area
Purchase History
| Date | Buyer | Sale Price | Title Company |
|---|---|---|---|
| Motsinger Derek W | $129,900 | Western Title & Escrow Co | |
| Garoutte Roxie | $101,000 | Western Title & Escrow Compa |
Source: Public Records
Mortgage History
| Date | Status | Borrower | Loan Amount |
|---|---|---|---|
| Open | Motsinger Derek W | $127,546 | |
| Previous Owner | Garoutte Roxie | $99,439 |
Source: Public Records
Tax History
| Year | Tax Paid | Tax Assessment Tax Assessment Total Assessment is a certain percentage of the fair market value that is determined by local assessors to be the total taxable value of land and additions on the property. | Land | Improvement |
|---|---|---|---|---|
| 2025 | $2,879 | $157,025 | -- | -- |
| 2024 | $2,833 | $152,452 | -- | -- |
| 2023 | $2,833 | $148,012 | $0 | $0 |
| 2022 | $2,624 | $143,701 | $0 | $0 |
| 2021 | $2,577 | $139,516 | $0 | $0 |
| 2020 | $2,501 | $135,453 | $0 | $0 |
| 2019 | $2,426 | $131,508 | $0 | $0 |
| 2018 | $2,287 | $123,959 | $0 | $0 |
| 2017 | $2,199 | $123,959 | $0 | $0 |
| 2016 | $2,153 | $120,349 | $0 | $0 |
| 2015 | $2,092 | $116,844 | $0 | $0 |
| 2014 | -- | $113,441 | $0 | $0 |
Source: Public Records
Map
Nearby Homes
Your Personal Tour Guide
Ask me questions while you tour the home.