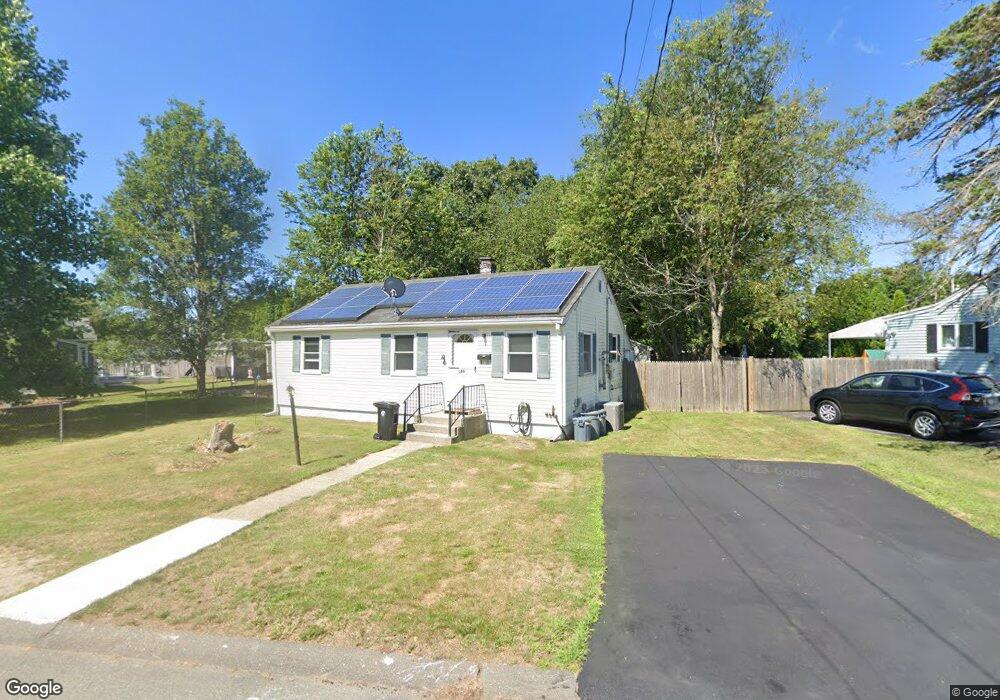
186 Algonquin St Brockton, MA 02302
Estimated Value: $401,151 - $549,000
3
Beds
1
Bath
748
Sq Ft
$589/Sq Ft
Est. Value
About This Home
This home is located at 186 Algonquin St, Brockton, MA 02302 and is currently estimated at $440,788, approximately $589 per square foot. 186 Algonquin St is a home located in Plymouth County with nearby schools including Brookfield Elementary School, Mary E. Baker Elementary School, and Downey Elementary School.
Ownership History
Date
Name
Owned For
Owner Type
Purchase Details
Closed on
May 14, 2020
Sold by
Spring Raymond S
Bought by
Spring Raymond S and Spring Sandra
Current Estimated Value
Purchase Details
Closed on
Mar 30, 2007
Sold by
Algonquin Street Rt
Bought by
Spring Raymond S
Home Financials for this Owner
Home Financials are based on the most recent Mortgage that was taken out on this home.
Original Mortgage
$171,200
Interest Rate
6.33%
Mortgage Type
Purchase Money Mortgage
Purchase Details
Closed on
Oct 11, 2006
Sold by
Coffidis Jeffrey
Bought by
Algonquin Street Rt
Home Financials for this Owner
Home Financials are based on the most recent Mortgage that was taken out on this home.
Original Mortgage
$185,000
Interest Rate
6.47%
Mortgage Type
Purchase Money Mortgage
Create a Home Valuation Report for This Property
The Home Valuation Report is an in-depth analysis detailing your home's value as well as a comparison with similar homes in the area
Purchase History
We collect this data history from publicly available records. To have your information removed, we recommend requesting removal directly through your county’s website.
| Date | Buyer | Sale Price | Title Company |
|---|---|---|---|
| Spring Raymond S | -- | None Available | |
| Spring Raymond S | $214,000 | -- | |
| Algonquin Street Rt | $185,000 | -- |
Source: Public Records
Mortgage History
We collect this data history from publicly available records. To have your information removed, we recommend requesting removal directly through your county’s website.
| Date | Status | Borrower | Loan Amount |
|---|---|---|---|
| Previous Owner | Algonquin Street Rt | $171,200 | |
| Previous Owner | Algonquin Street Rt | $185,000 |
Source: Public Records
Tax History
| Year | Tax Paid | Tax Assessment Tax Assessment Total Assessment is a certain percentage of the fair market value that is determined by local assessors to be the total taxable value of land and additions on the property. | Land | Improvement |
|---|---|---|---|---|
| 2025 | $4,346 | $358,900 | $143,800 | $215,100 |
| 2024 | $3,959 | $329,400 | $143,800 | $185,600 |
| 2023 | $3,989 | $307,300 | $108,400 | $198,900 |
| 2022 | $3,446 | $246,700 | $98,400 | $148,300 |
| 2021 | $3,229 | $222,700 | $90,400 | $132,300 |
| 2020 | $2,983 | $196,900 | $86,900 | $110,000 |
| 2019 | $2,867 | $184,500 | $80,100 | $104,400 |
| 2018 | $2,827 | $176,000 | $80,100 | $95,900 |
| 2017 | $2,465 | $153,100 | $80,100 | $73,000 |
| 2016 | $2,090 | $120,400 | $76,300 | $44,100 |
| 2015 | $2,080 | $114,600 | $76,300 | $38,300 |
| 2014 | $2,263 | $124,800 | $76,300 | $48,500 |
Source: Public Records
Map
Nearby Homes
- 192 Algonquin St
- 178 Algonquin St
- 189 Drew Ave
- 181 Drew Ave
- 198 Algonquin St
- 183 Algonquin St
- 191 Algonquin St
- 195 Drew Ave
- 177 Algonquin St
- 197 Algonquin St
- 204 Algonquin St
- 201 Drew Ave
- 198 Thomas St
- 175 Thomas St
- 168 Algonquin St
- 203 Algonquin St
- 171 Drew Ave
- 210 Algonquin St
- 110 Bradley Ave
- 184 Drew Ave
Your Personal Tour Guide
Ask me questions while you tour the home.