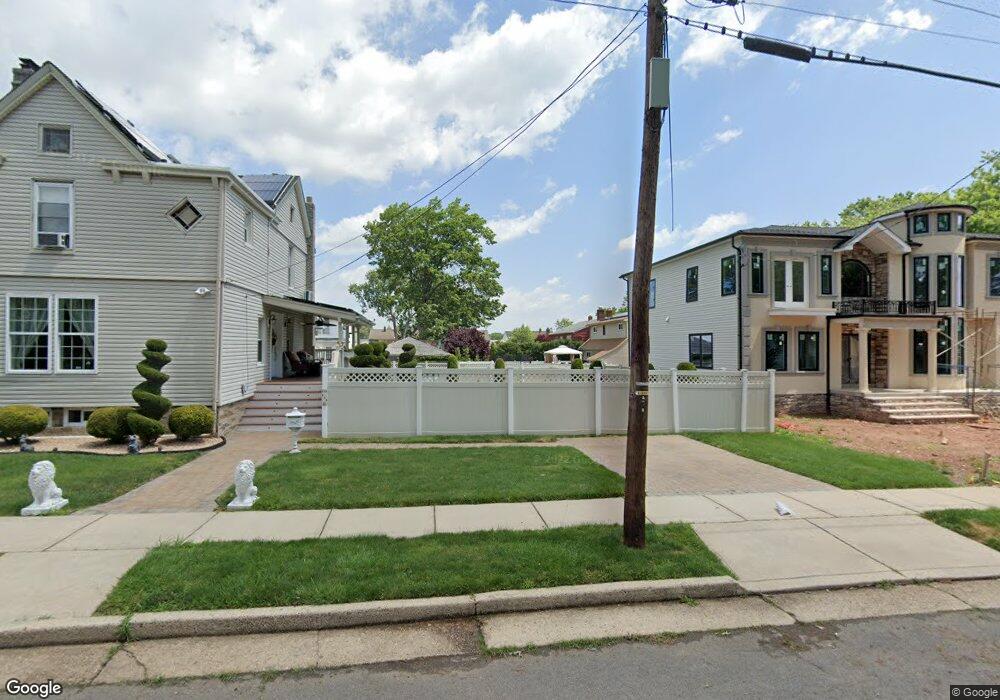
186 E Elm St Carteret, NJ 07008
Estimated Value: $298,000 - $656,141
2
Beds
1
Bath
1,188
Sq Ft
$409/Sq Ft
Est. Value
About This Home
This home is located at 186 E Elm St, Carteret, NJ 07008 and is currently estimated at $485,714, approximately $408 per square foot. 186 E Elm St is a home located in Middlesex County with nearby schools including Carteret High School and St Joseph School.
Ownership History
Date
Name
Owned For
Owner Type
Purchase Details
Closed on
May 4, 2020
Sold by
U S Bank National Association
Bought by
Randhawa Sandeep Singh
Current Estimated Value
Purchase Details
Closed on
Jan 22, 2020
Sold by
Zullo Anthony and Zullo Caria
Bought by
Us Bank National Association and Structured Asset Investment Loan Trust
Purchase Details
Closed on
Dec 20, 2000
Sold by
Zullo Margaret
Bought by
Zullo Anthony and Zullo Carla
Home Financials for this Owner
Home Financials are based on the most recent Mortgage that was taken out on this home.
Original Mortgage
$99,380
Interest Rate
7.01%
Create a Home Valuation Report for This Property
The Home Valuation Report is an in-depth analysis detailing your home's value as well as a comparison with similar homes in the area
Home Values in the Area
Average Home Value in this Area
Purchase History
| Date | Buyer | Sale Price | Title Company |
|---|---|---|---|
| Randhawa Sandeep Singh | $166,500 | Servicelink Ttl Co Default T | |
| Us Bank National Association | -- | None Available | |
| Zullo Anthony | $95,000 | -- |
Source: Public Records
Mortgage History
| Date | Status | Borrower | Loan Amount |
|---|---|---|---|
| Previous Owner | Zullo Anthony | $99,380 |
Source: Public Records
Tax History Compared to Growth
Tax History
| Year | Tax Paid | Tax Assessment Tax Assessment Total Assessment is a certain percentage of the fair market value that is determined by local assessors to be the total taxable value of land and additions on the property. | Land | Improvement |
|---|---|---|---|---|
| 2025 | $17,735 | $1,031,000 | $354,500 | $676,500 |
| 2024 | $4,115 | $556,300 | $132,500 | $423,800 |
| 2023 | $4,115 | $132,500 | $132,500 | $0 |
| 2022 | $4,002 | $132,500 | $132,500 | $0 |
| 2021 | $5,907 | $266,900 | $132,500 | $134,400 |
| 2020 | $7,676 | $266,900 | $132,500 | $134,400 |
| 2019 | $7,455 | $266,900 | $132,500 | $134,400 |
| 2018 | $7,278 | $266,900 | $132,500 | $134,400 |
| 2017 | $7,019 | $266,900 | $132,500 | $134,400 |
| 2016 | $6,869 | $216,900 | $102,500 | $114,400 |
| 2015 | $6,769 | $216,900 | $102,500 | $114,400 |
| 2014 | $6,474 | $216,900 | $102,500 | $114,400 |
Source: Public Records
Map
Nearby Homes