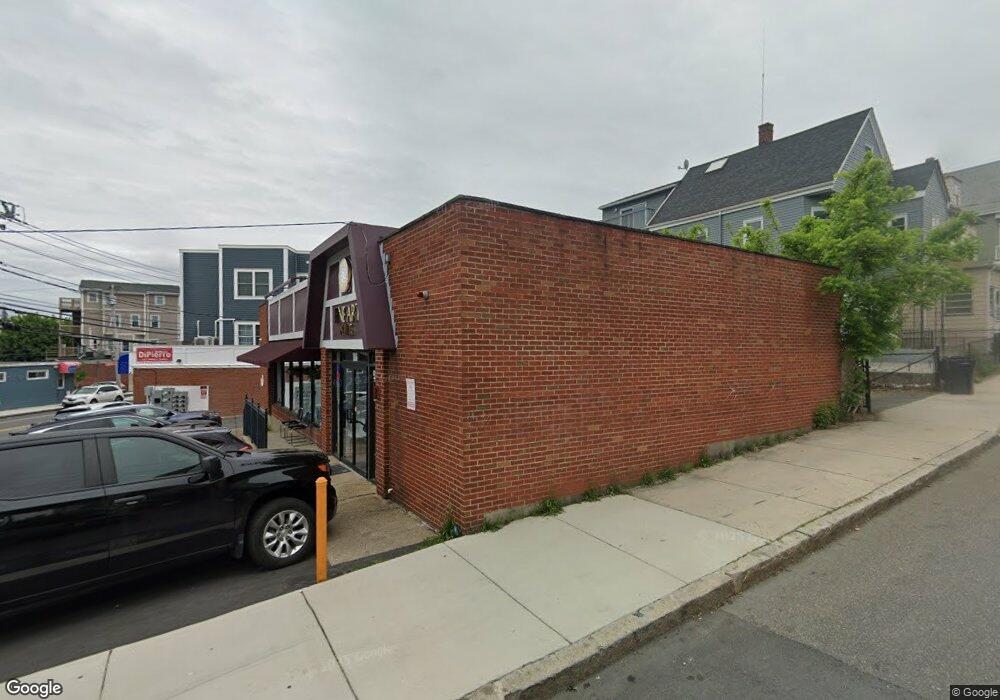
186 Elm St Everett, MA 02149
Glendale NeighborhoodEstimated Value: $706,769
Studio
--
Bath
1,920
Sq Ft
$368/Sq Ft
Est. Value
About This Home
This home is located at 186 Elm St, Everett, MA 02149 and is currently estimated at $706,769, approximately $368 per square foot. 186 Elm St is a home located in Middlesex County with nearby schools including Everett High School and Pioneer Charter School of Science.
Ownership History
Date
Name
Owned For
Owner Type
Purchase Details
Closed on
Oct 11, 2022
Sold by
Ngo Diep N
Bought by
Ltl Management Llc
Current Estimated Value
Purchase Details
Closed on
Sep 12, 1997
Sold by
Mayden Inc
Bought by
Ngo Diep Ngoc and Ngo Minh Hao
Home Financials for this Owner
Home Financials are based on the most recent Mortgage that was taken out on this home.
Original Mortgage
$120,000
Interest Rate
7.31%
Mortgage Type
Commercial
Purchase Details
Closed on
Jul 31, 1995
Sold by
Cacciola Joseph and Cacciola Grace
Bought by
Mayden Inc
Home Financials for this Owner
Home Financials are based on the most recent Mortgage that was taken out on this home.
Original Mortgage
$100,000
Interest Rate
7.56%
Mortgage Type
Commercial
Purchase Details
Closed on
Dec 7, 1992
Sold by
White Hen Pantry Inc
Bought by
Cacciola Joseph and Cacciola Grace
Home Financials for this Owner
Home Financials are based on the most recent Mortgage that was taken out on this home.
Original Mortgage
$124,500
Interest Rate
8.22%
Mortgage Type
Commercial
Create a Home Valuation Report for This Property
The Home Valuation Report is an in-depth analysis detailing your home's value as well as a comparison with similar homes in the area
Home Values in the Area
Average Home Value in this Area
Purchase History
| Date | Buyer | Sale Price | Title Company |
|---|---|---|---|
| Ltl Management Llc | -- | None Available | |
| Ngo Diep Ngoc | $160,000 | -- | |
| Mayden Inc | $146,000 | -- | |
| Cacciola Joseph | $180,000 | -- |
Source: Public Records
Mortgage History
| Date | Status | Borrower | Loan Amount |
|---|---|---|---|
| Previous Owner | Cacciola Joseph | $375,000 | |
| Previous Owner | Cacciola Joseph | $120,000 | |
| Previous Owner | Cacciola Joseph | $100,000 | |
| Previous Owner | Cacciola Joseph | $124,500 |
Source: Public Records
Tax History
| Year | Tax Paid | Tax Assessment Tax Assessment Total Assessment is a certain percentage of the fair market value that is determined by local assessors to be the total taxable value of land and additions on the property. | Land | Improvement |
|---|---|---|---|---|
| 2025 | $16,838 | $732,100 | $422,200 | $309,900 |
| 2024 | $16,546 | $689,400 | $395,800 | $293,600 |
| 2023 | $16,809 | $662,800 | $380,000 | $282,800 |
| 2022 | $15,559 | $647,200 | $364,100 | $283,100 |
| 2021 | $14,433 | $622,100 | $348,300 | $273,800 |
| 2020 | $14,207 | $574,700 | $316,600 | $258,100 |
| 2019 | $20,989 | $595,100 | $316,600 | $278,500 |
| 2018 | $15,672 | $464,500 | $186,000 | $278,500 |
| 2017 | $16,025 | $449,000 | $170,500 | $278,500 |
| 2016 | $16,609 | $437,300 | $158,800 | $278,500 |
| 2015 | $17,516 | $444,000 | $158,800 | $285,200 |
Source: Public Records
Map
Nearby Homes
- 211 Elm St
- 30 Clarence St
- 260 Elm St
- 55 Garland St
- 53 Sycamore St
- 101 Springvale Ave
- 40 Glendale Ave
- 30 Woodlawn St
- 138 Fremont Ave
- 859 Broadway Unit 15
- 881 Broadway Unit 28
- 450 Vane St
- 114 Francis St
- 581 & 233 Proctor & Washington Ave
- 15 Waverly Ave
- 12 Hamilton St Unit 8
- 89 Dale St
- 110 Ferry St
- 90 Oxford St
- 5 Mason St
- 178 Elm St Unit 2
- 178 Elm St Unit 8
- 178 Elm St Unit 7
- 178 Elm St Unit 5
- 178 Elm St Unit 3-6
- 178 Elm St Unit 2-2
- 178 Elm St Unit 2-3
- 178 Elm St Unit 2-4
- 14 Calhoun Ave
- 14 Calhoun Ave Unit 1
- 14 Calhoun Ave Unit 2
- 179 Elm St
- 179 Elm St Unit 3
- 5 Calhoun Ave
- 183 Elm St
- 183 Elm St Unit 183
- 192 Elm St
- 192-196 Elm St
- 9 Calhoun Ave
- 187 Elm St
Your Personal Tour Guide
Ask me questions while you tour the home.