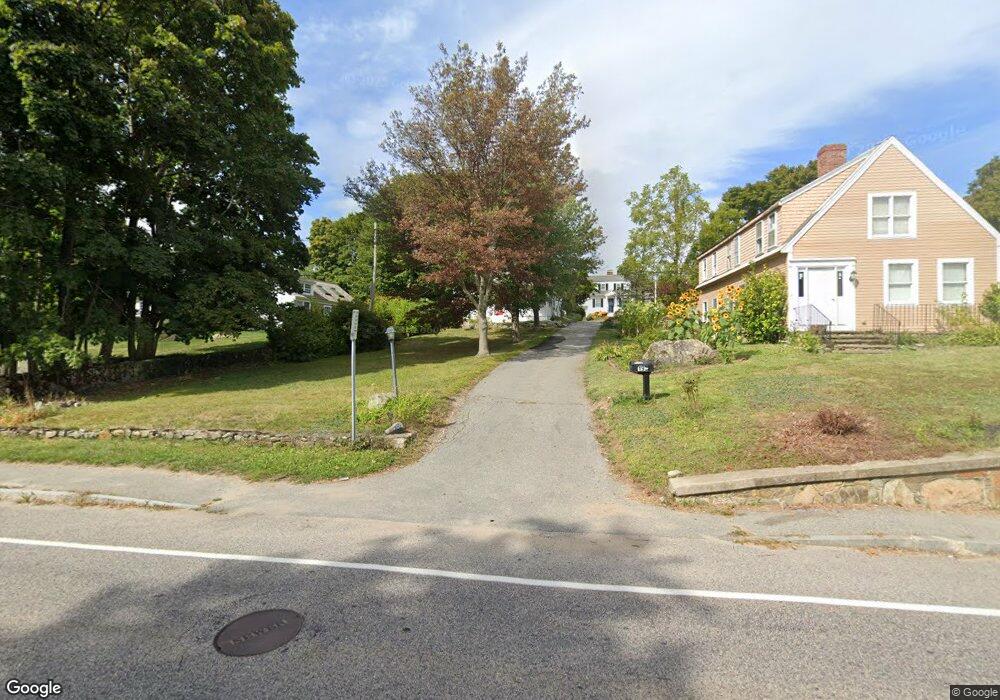
186 Hull St Hingham, MA 02043
Estimated Value: $766,880 - $953,000
4
Beds
3
Baths
1,830
Sq Ft
$472/Sq Ft
Est. Value
About This Home
This home is located at 186 Hull St, Hingham, MA 02043 and is currently estimated at $863,220, approximately $471 per square foot. 186 Hull St is a home located in Plymouth County with nearby schools including East Elementary School, Hingham Middle School, and Hingham High School.
Ownership History
Date
Name
Owned For
Owner Type
Purchase Details
Closed on
May 27, 2021
Sold by
Monarch Michael J and Monarch Elena S
Bought by
Monarch Ft
Current Estimated Value
Purchase Details
Closed on
Mar 9, 2010
Sold by
Thurston Colleen A and Thurston Charles W
Bought by
Walden-Thurston Justine L
Purchase Details
Closed on
Mar 10, 2003
Sold by
Raynes Charles E and Raynes Catherine E
Bought by
Monarch Michael J and Monarch Elena S
Purchase Details
Closed on
Apr 26, 2002
Sold by
Dickman Craig T and Dickman Audrey V
Bought by
Parker Jeremy F and Parker Michelle L
Purchase Details
Closed on
Dec 18, 1998
Sold by
Nace David J and Destasio Catherine A
Bought by
Raynes Charles E and Raynes Catherine E
Purchase Details
Closed on
May 17, 1996
Sold by
Saleski Douglas R and Saleski Kathryn M
Bought by
Nace David J and Destasio Catherine A
Create a Home Valuation Report for This Property
The Home Valuation Report is an in-depth analysis detailing your home's value as well as a comparison with similar homes in the area
Purchase History
| Date | Buyer | Sale Price | Title Company |
|---|---|---|---|
| Monarch Ft | -- | None Available | |
| Walden-Thurston Justine L | -- | -- | |
| Monarch Michael J | $366,000 | -- | |
| Parker Jeremy F | $330,000 | -- | |
| Raynes Charles E | $245,000 | -- | |
| Nace David J | $199,900 | -- |
Source: Public Records
Mortgage History
| Date | Status | Borrower | Loan Amount |
|---|---|---|---|
| Previous Owner | Nace David J | $328,000 |
Source: Public Records
Tax History
| Year | Tax Paid | Tax Assessment Tax Assessment Total Assessment is a certain percentage of the fair market value that is determined by local assessors to be the total taxable value of land and additions on the property. | Land | Improvement |
|---|---|---|---|---|
| 2025 | $7,027 | $657,300 | $315,000 | $342,300 |
| 2024 | $6,352 | $585,400 | $315,000 | $270,400 |
| 2023 | $5,499 | $549,900 | $292,500 | $257,400 |
| 2022 | $5,918 | $511,900 | $255,000 | $256,900 |
| 2021 | $5,673 | $480,800 | $255,000 | $225,800 |
| 2020 | $5,469 | $474,300 | $255,000 | $219,300 |
| 2019 | $5,431 | $459,900 | $255,000 | $204,900 |
| 2018 | $5,319 | $451,900 | $255,000 | $196,900 |
| 2017 | $5,205 | $424,900 | $250,400 | $174,500 |
| 2016 | $5,121 | $410,000 | $238,500 | $171,500 |
| 2015 | $4,696 | $374,800 | $210,900 | $163,900 |
Source: Public Records
Map
Nearby Homes
- 166 Hull St
- 2 Cliff Rd
- 114 Hull St
- 99 Nantasket Ave
- 23 Wyola Rd
- LOT 1B Rockland St
- 121 Nantasket Ave Unit 503
- 155 George Washington Blvd Unit 210
- 1 Longbeach Ave Unit 202
- 22 Berkley Rd Unit B
- 6 State Park Rd Unit 2
- 4 Atherton Rd
- 62 Oceanside Dr
- 181 Atlantic Ave
- 9 Park Ave Unit 202
- 130 Forest Ave
- 14 Cedarledge Village
- 101 Rockland St
- 597 Jerusalem Rd
- 560 Jerusalem Rd
Your Personal Tour Guide
Ask me questions while you tour the home.