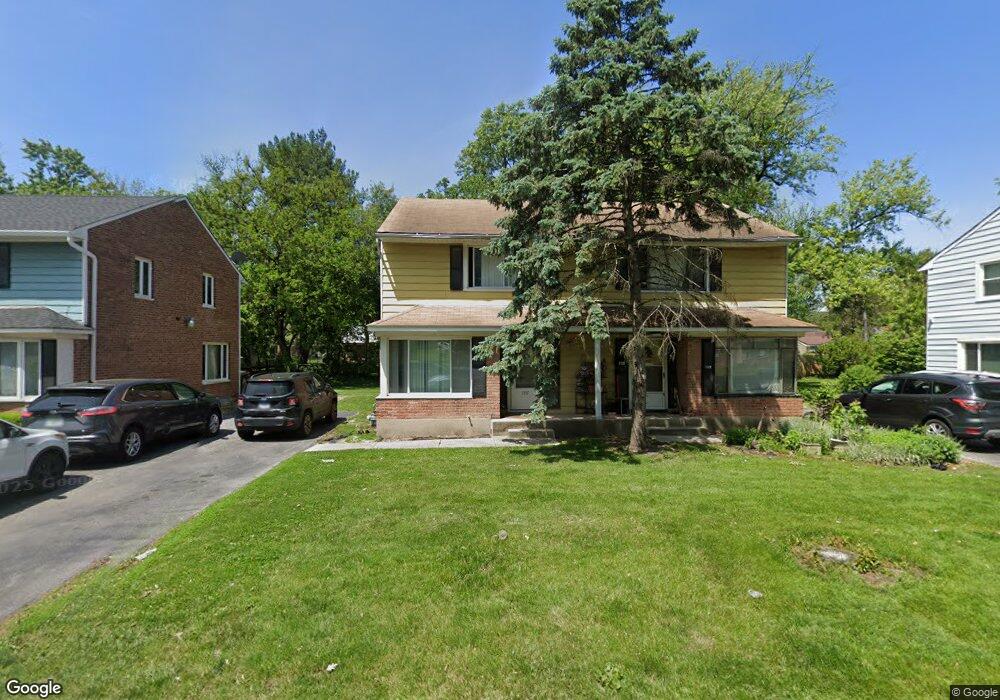
186 Lester Rd Unit 722 Park Forest, IL 60466
Estimated Value: $70,000 - $81,000
2
Beds
1
Bath
900
Sq Ft
$84/Sq Ft
Est. Value
About This Home
This home is located at 186 Lester Rd Unit 722, Park Forest, IL 60466 and is currently estimated at $75,153, approximately $83 per square foot. 186 Lester Rd Unit 722 is a home located in Cook County with nearby schools including 21st Century Primary Center, Blackhawk Intermediate Center, and Michelle Obama School of Technology.
Ownership History
Date
Name
Owned For
Owner Type
Purchase Details
Closed on
Mar 27, 2023
Sold by
Arthington Properties Llc
Bought by
Woods Courtney
Current Estimated Value
Purchase Details
Closed on
May 18, 2022
Sold by
Yarbrough Karen A
Bought by
Arthington Properties Llc
Purchase Details
Closed on
Oct 13, 2010
Sold by
Haesler Jon
Bought by
Dandridge Lashonda
Home Financials for this Owner
Home Financials are based on the most recent Mortgage that was taken out on this home.
Original Mortgage
$36,500
Interest Rate
4.37%
Mortgage Type
Seller Take Back
Purchase Details
Closed on
Feb 19, 2008
Sold by
Nationscredit Financial Services Corp
Bought by
Haesler Jon
Purchase Details
Closed on
Sep 14, 2007
Sold by
Williams Peter and Case #02 Ch 15262
Bought by
Nationscredit Financial Services Corp
Create a Home Valuation Report for This Property
The Home Valuation Report is an in-depth analysis detailing your home's value as well as a comparison with similar homes in the area
Home Values in the Area
Average Home Value in this Area
Purchase History
| Date | Buyer | Sale Price | Title Company |
|---|---|---|---|
| Woods Courtney | $60,000 | First American Title | |
| Arthington Properties Llc | -- | None Listed On Document | |
| Dandridge Lashonda | $39,000 | Chicago Title Insurance Co | |
| Haesler Jon | $36,000 | Ticor Title | |
| Nationscredit Financial Services Corp | -- | Ticor |
Source: Public Records
Mortgage History
| Date | Status | Borrower | Loan Amount |
|---|---|---|---|
| Previous Owner | Dandridge Lashonda | $36,500 |
Source: Public Records
Tax History Compared to Growth
Tax History
| Year | Tax Paid | Tax Assessment Tax Assessment Total Assessment is a certain percentage of the fair market value that is determined by local assessors to be the total taxable value of land and additions on the property. | Land | Improvement |
|---|---|---|---|---|
| 2024 | $3,754 | $5,130 | $1,539 | $3,591 |
| 2023 | $2,298 | $5,130 | $1,539 | $3,591 |
| 2022 | $2,298 | $1,710 | $1,649 | $61 |
| 2021 | $2,255 | $1,709 | $1,648 | $61 |
| 2020 | $2,056 | $1,709 | $1,648 | $61 |
| 2019 | $2,970 | $2,729 | $1,538 | $1,191 |
| 2018 | $3,767 | $3,591 | $1,538 | $2,053 |
| 2017 | $3,744 | $3,591 | $1,538 | $2,053 |
| 2016 | $4,701 | $4,728 | $1,428 | $3,300 |
| 2015 | $4,594 | $4,728 | $1,428 | $3,300 |
| 2014 | $4,458 | $4,728 | $1,428 | $3,300 |
| 2013 | $3,275 | $3,877 | $1,428 | $2,449 |
Source: Public Records
Map
Nearby Homes
- 71 Cherry St
- 35 Mcgarity Rd Unit 772
- 226 S Orchard Dr
- 27 Apple Ct
- 28 Apple Ln
- 42 Sauk Trail
- 22 Apple Ln
- 74 Marquette St
- 3538 Western Ave Unit 84
- 62 Marquette St
- 43 Indianwood Blvd Unit 181
- 23 Oak Ln
- 123 Peach St
- 17 Oak Ln
- 16 Sauk Trail
- 131 Sauk Trail
- 320 Oswego St
- 320 Oakwood St
- 313 Oakwood St
- 326 Nassau St
- 184 Lester Rd Unit 721
- 188 Lester Rd Unit 731
- 180 Lester Rd Unit 711
- 178 Lester Rd Unit 74
- 178 Lester Rd Unit 702
- 182 Lester Rd Unit 712
- 192 Lester Rd Unit 741
- 194 Lester Rd Unit 742
- 190 Lester Rd Unit 732
- 176 Lester Rd Unit 701
- 58 Cherry St
- 56 Cherry St
- 60 Cherry St
- 54 Cherry St
- 174 Lester Rd Unit 692
- 62 Cherry St
- 172 Lester Rd Unit 691
- 211 Lester Rd Unit 752
- 209 Lester Rd Unit 751
- 64 Cherry St