Estimated Value: $238,000 - $312,542
3
Beds
2
Baths
2,141
Sq Ft
$129/Sq Ft
Est. Value
About This Home
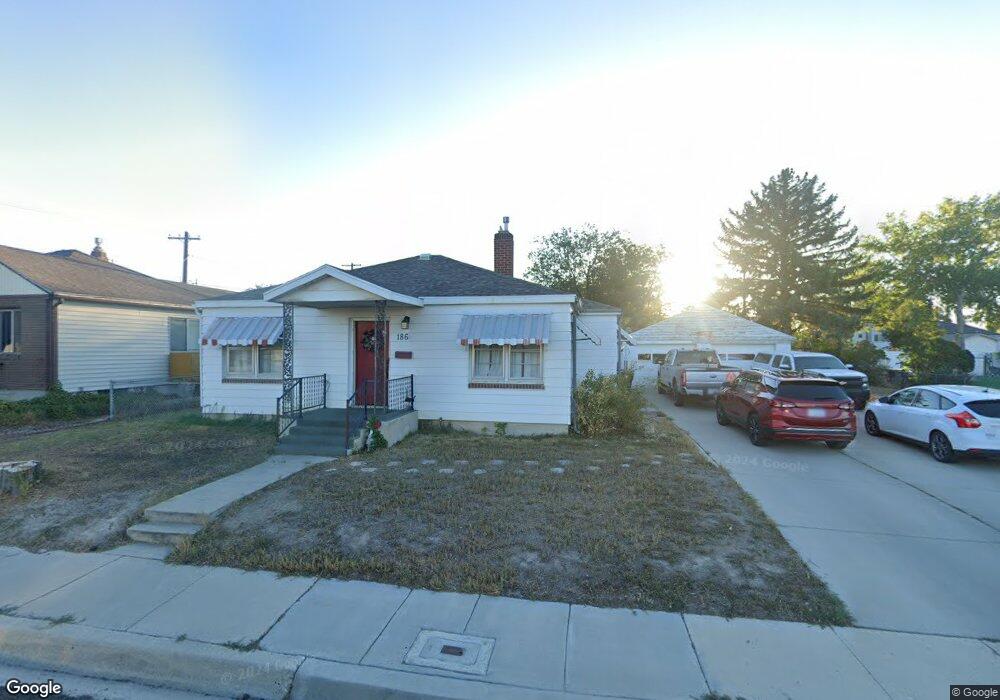
This home is located at 186 N 400 W, Price, UT 84501 and is currently estimated at $275,886, approximately $128 per square foot. 186 N 400 W is a home located in Carbon County with nearby schools including Castle Heights School, Mont Harmon Junior High School, and Carbon High School.
Ownership History
Date
Name
Owned For
Owner Type
Purchase Details
Closed on
Dec 30, 2019
Sold by
Frandsen Cheryl M
Bought by
Ansted Jarod and Ansted Shelby
Current Estimated Value
Home Financials for this Owner
Home Financials are based on the most recent Mortgage that was taken out on this home.
Original Mortgage
$97,425
Outstanding Balance
$85,709
Interest Rate
3.6%
Mortgage Type
New Conventional
Estimated Equity
$190,177
Purchase Details
Closed on
Nov 19, 2014
Sold by
Powell Brent A and Strong Doreen
Bought by
Frandsen Cheryl M
Home Financials for this Owner
Home Financials are based on the most recent Mortgage that was taken out on this home.
Original Mortgage
$104,554
Interest Rate
4.4%
Mortgage Type
FHA
Create a Home Valuation Report for This Property
The Home Valuation Report is an in-depth analysis detailing your home's value as well as a comparison with similar homes in the area
Home Values in the Area
Average Home Value in this Area
Purchase History
| Date | Buyer | Sale Price | Title Company |
|---|---|---|---|
| Ansted Jarod | -- | Professional Title Services | |
| Frandsen Cheryl M | -- | None Available |
Source: Public Records
Mortgage History
| Date | Status | Borrower | Loan Amount |
|---|---|---|---|
| Open | Ansted Jarod | $97,425 | |
| Previous Owner | Frandsen Cheryl M | $104,554 |
Source: Public Records
Tax History Compared to Growth
Tax History
| Year | Tax Paid | Tax Assessment Tax Assessment Total Assessment is a certain percentage of the fair market value that is determined by local assessors to be the total taxable value of land and additions on the property. | Land | Improvement |
|---|---|---|---|---|
| 2025 | $1,201 | $98,868 | $21,465 | $77,403 |
| 2024 | $1,850 | $154,023 | $16,170 | $137,853 |
| 2023 | $1,030 | $91,464 | $9,781 | $81,683 |
| 2022 | $1,074 | $85,553 | $8,132 | $77,421 |
| 2021 | $926 | $114,428 | $12,424 | $102,004 |
| 2020 | $909 | $56,382 | $0 | $0 |
| 2019 | $810 | $52,678 | $0 | $0 |
| 2018 | $770 | $51,091 | $0 | $0 |
| 2017 | $760 | $51,091 | $0 | $0 |
| 2016 | $686 | $51,091 | $0 | $0 |
| 2015 | $686 | $51,091 | $0 | $0 |
| 2014 | $681 | $51,091 | $0 | $0 |
| 2013 | $652 | $48,406 | $0 | $0 |
Source: Public Records
Map
Nearby Homes