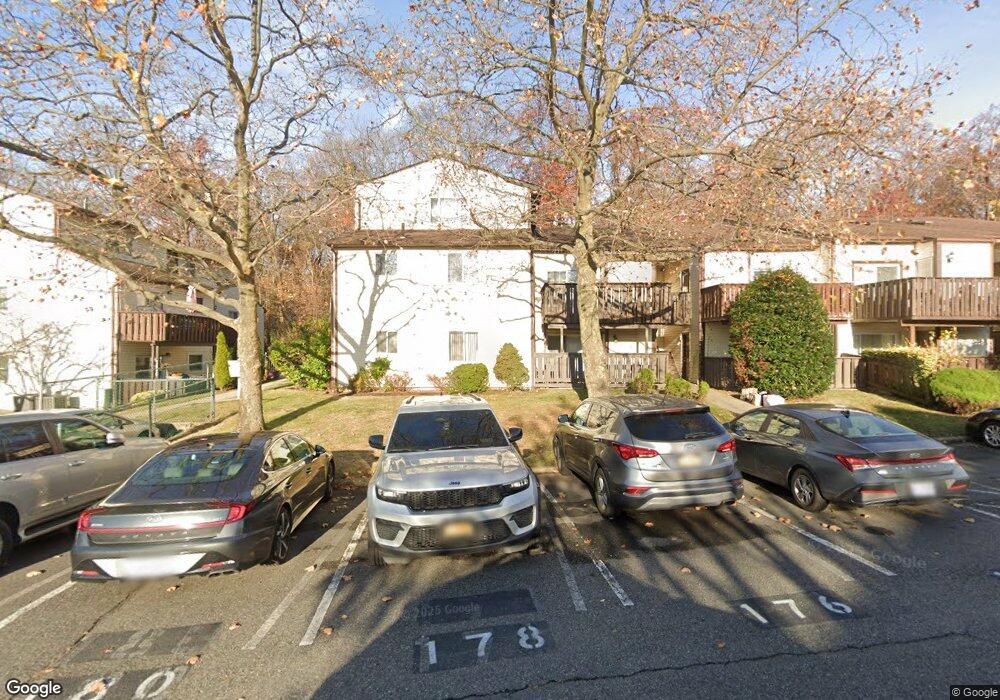
186 Timber Ridge Dr Unit 186 Staten Island, NY 10306
Great Kills NeighborhoodEstimated Value: $443,000 - $556,000
3
Beds
2
Baths
1,750
Sq Ft
$285/Sq Ft
Est. Value
About This Home
This home is located at 186 Timber Ridge Dr Unit 186, Staten Island, NY 10306 and is currently estimated at $497,884, approximately $284 per square foot. 186 Timber Ridge Dr Unit 186 is a home located in Richmond County with nearby schools including P.S. 53 The Barbara Esselborn School, Myra S. Barnes Intermediate School 24, and Susan E Wagner High School.
Ownership History
Date
Name
Owned For
Owner Type
Purchase Details
Closed on
Aug 18, 2016
Sold by
Smirnov Vitaliy and Smirnova Lidiya
Bought by
Khurina Zina
Current Estimated Value
Home Financials for this Owner
Home Financials are based on the most recent Mortgage that was taken out on this home.
Original Mortgage
$265,500
Outstanding Balance
$211,633
Interest Rate
3.45%
Mortgage Type
New Conventional
Estimated Equity
$286,251
Purchase Details
Closed on
Apr 5, 2006
Sold by
Christie Michael and Scalzo Dennis
Bought by
Finales Virginia
Purchase Details
Closed on
Jan 13, 2005
Sold by
Finales Virginia
Bought by
Christie Michael and Scalzo Dennis
Purchase Details
Closed on
Mar 1, 1995
Sold by
Ziegler Barbara and Lambros Joan
Bought by
Finales Virginia
Home Financials for this Owner
Home Financials are based on the most recent Mortgage that was taken out on this home.
Original Mortgage
$57,000
Interest Rate
9.09%
Create a Home Valuation Report for This Property
The Home Valuation Report is an in-depth analysis detailing your home's value as well as a comparison with similar homes in the area
Home Values in the Area
Average Home Value in this Area
Purchase History
| Date | Buyer | Sale Price | Title Company |
|---|---|---|---|
| Khurina Zina | $295,000 | None Available | |
| Finales Virginia | -- | None Available | |
| Christie Michael | -- | -- | |
| Finales Virginia | $103,000 | -- |
Source: Public Records
Mortgage History
| Date | Status | Borrower | Loan Amount |
|---|---|---|---|
| Open | Khurina Zina | $265,500 | |
| Previous Owner | Finales Virginia | $57,000 |
Source: Public Records
Tax History Compared to Growth
Tax History
| Year | Tax Paid | Tax Assessment Tax Assessment Total Assessment is a certain percentage of the fair market value that is determined by local assessors to be the total taxable value of land and additions on the property. | Land | Improvement |
|---|---|---|---|---|
| 2025 | $3,810 | $25,654 | $628 | $25,026 |
| 2024 | $3,810 | $23,828 | $671 | $23,157 |
| 2023 | $3,634 | $17,894 | $636 | $17,258 |
| 2022 | $3,370 | $18,903 | $843 | $18,060 |
| 2021 | $3,352 | $18,903 | $843 | $18,060 |
| 2020 | $3,371 | $19,217 | $843 | $18,374 |
| 2019 | $3,306 | $17,802 | $843 | $16,959 |
| 2018 | $3,040 | $14,912 | $685 | $14,227 |
| 2017 | $2,868 | $14,068 | $702 | $13,366 |
| 2016 | $2,653 | $13,273 | $687 | $12,586 |
| 2015 | $2,528 | $13,273 | $748 | $12,525 |
| 2014 | $2,528 | $13,172 | $697 | $12,475 |
Source: Public Records
Map
Nearby Homes
- 46 Meadow Ln Unit B13
- 20 Meadow Ln
- 52 Timber Ridge Dr Unit 52
- 16 Fawn Ln
- 155 Woodcutters Ln
- 34 Stern Ct
- 42 Greaves Ave
- 3721 Amboy Rd
- 3723 Amboy Rd
- 22 Bay Terrace Unit 2e
- 29 Ashwood Ct
- 3486 Amboy Rd Unit 2H
- 16 Bay Terrace Unit 2f
- 132 Dewey Ave
- 17 Greaves Ct
- 3461 Amboy Rd Unit 1J
- 3745 Amboy Rd Unit 10B
- 28 Bay Terrace Unit 2H
- 3747 Amboy Rd Unit 6b
- 106 Redwood Ave
- 188 Timber Ridge Dr Unit 188
- 180 Timber Ridge Dr Unit 180
- 184 Timber Ridge Dr Unit 184
- 182 Timber Ridge Dr Unit 182
- 178 Timber Ridge Dr
- 50 Timber Ridge Dr Unit 50
- 174 Timber Ridge Dr Unit 174
- 190 Timber Ridge Dr Unit 7190
- 176 Timber Ridge Dr Unit 176
- 194 Timber Ridge Dr Unit 7194
- 192 Timber Ridge Dr Unit 7192
- 172 Timber Ridge Dr Unit 172
- 170 Timber Ridge Dr Unit 170
- 196 Timber Ridge Dr Unit 7196
- 198 Timber Ridge Dr Unit 7198
- 168 Timber Ridge Dr
- 200 Timber Ridge Dr Unit 7200
- 166 Timber Ridge Dr Unit 166
- 202 Timber Ridge Dr Unit 7202
- 204 Timber Ridge Dr Unit 7204