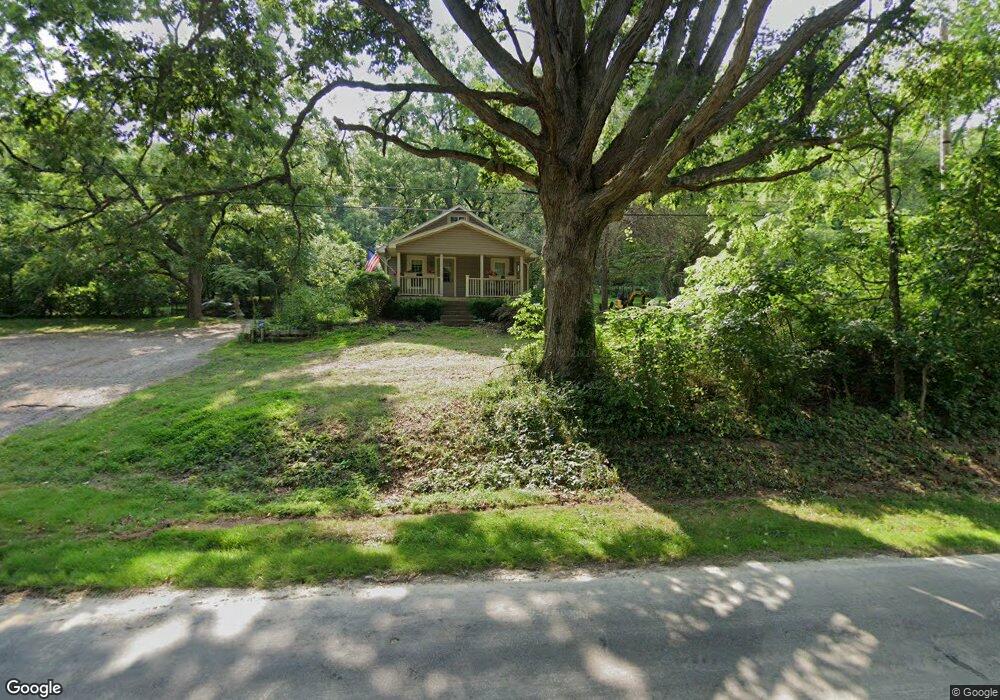
1860 Boving Rd SW Lancaster, OH 43130
Estimated Value: $134,000 - $285,000
2
Beds
1
Bath
1,008
Sq Ft
$224/Sq Ft
Est. Value
About This Home
This home is located at 1860 Boving Rd SW, Lancaster, OH 43130 and is currently estimated at $225,971, approximately $224 per square foot. 1860 Boving Rd SW is a home located in Fairfield County with nearby schools including Tallmadge Elementary School, General Sherman Junior High School, and Lancaster High School.
Ownership History
Date
Name
Owned For
Owner Type
Purchase Details
Closed on
Jul 9, 2014
Sold by
Borchers Eric C
Bought by
Borchers Jodie M
Current Estimated Value
Home Financials for this Owner
Home Financials are based on the most recent Mortgage that was taken out on this home.
Original Mortgage
$84,000
Outstanding Balance
$63,115
Interest Rate
4.19%
Mortgage Type
New Conventional
Estimated Equity
$162,856
Purchase Details
Closed on
Mar 1, 2000
Sold by
Conrad Dennis R
Bought by
Borchers Eric C and Borchers Jodi M
Home Financials for this Owner
Home Financials are based on the most recent Mortgage that was taken out on this home.
Original Mortgage
$83,700
Interest Rate
8.27%
Mortgage Type
New Conventional
Purchase Details
Closed on
Jan 29, 1998
Sold by
Conrad Brett A
Bought by
Conrad Dennis R
Purchase Details
Closed on
Apr 1, 1994
Sold by
Berry James D
Bought by
Berry James D
Purchase Details
Closed on
Mar 14, 1994
Sold by
Tignor Anna Mary
Bought by
Berry James D
Create a Home Valuation Report for This Property
The Home Valuation Report is an in-depth analysis detailing your home's value as well as a comparison with similar homes in the area
Purchase History
| Date | Buyer | Sale Price | Title Company |
|---|---|---|---|
| Borchers Jodie M | -- | Attorney | |
| Borchers Eric C | $93,000 | -- | |
| Conrad Dennis R | $72,000 | -- | |
| Berry James D | $20,000 | -- | |
| Berry James D | $20,000 | -- |
Source: Public Records
Mortgage History
| Date | Status | Borrower | Loan Amount |
|---|---|---|---|
| Open | Borchers Jodie M | $84,000 | |
| Closed | Borchers Eric C | $83,700 | |
| Closed | Conrad Dennis R | $0 |
Source: Public Records
Tax History
| Year | Tax Paid | Tax Assessment Tax Assessment Total Assessment is a certain percentage of the fair market value that is determined by local assessors to be the total taxable value of land and additions on the property. | Land | Improvement |
|---|---|---|---|---|
| 2025 | $5,293 | $75,830 | $39,760 | $36,070 |
| 2024 | $5,293 | $57,220 | $19,710 | $37,510 |
| 2023 | $2,147 | $57,220 | $19,710 | $37,510 |
| 2022 | $2,175 | $57,220 | $19,710 | $37,510 |
| 2021 | $1,895 | $46,260 | $17,920 | $28,340 |
| 2020 | $1,779 | $46,260 | $17,920 | $28,340 |
| 2019 | $1,652 | $46,260 | $17,920 | $28,340 |
| 2018 | $1,338 | $38,060 | $17,020 | $21,040 |
| 2017 | $1,338 | $35,380 | $14,340 | $21,040 |
| 2016 | $1,304 | $35,380 | $14,340 | $21,040 |
| 2015 | $1,226 | $34,450 | $14,340 | $20,110 |
| 2014 | $1,164 | $34,450 | $14,340 | $20,110 |
| 2013 | $1,164 | $34,450 | $14,340 | $20,110 |
Source: Public Records
Map
Nearby Homes
- 0 Highland Ave
- 772 Pennsylvania Ave
- 729 Pennsylvania Ave
- 126 Twin Creek Way
- 453 Bren Dr
- 219 Peters Ave
- 2300 Stonewall Cemetery Rd SW
- 0 Hamburg Rd SW
- 0 Hamburg Rd SW Unit 226000938
- 114-116 S Cedar Ave
- 2241 Brookside Dr
- 157 Cedar Hill Rd
- 233 Lewis Ave
- 1414 Cedar Hill Rd
- 1511 Cedar Hill Rd
- 132 N Pierce Ave
- 113 N George St
- 520 W Wheeling St
- 810 4th St
- 302 Washington Ave
- 740 Boving Rd
- 726 Boving Rd
- 824 Highland Ave
- 822 Highland Ave
- 820 Highland Ave
- 1960 Boving Rd SW
- 818 Highland Ave
- 814 Highland Ave
- 698 Boving Rd
- 1832 Boving Rd SW
- 810 Highland Ave
- 813 Highland Ave
- 809 Highland Ave
- 804 Highland Ave
- 1830 Boving Rd SW
- 2010 Boving Rd SW
- 678 Boving Rd
- 2009 Boving Rd SW
- 807 Highland Ave
- 805 Highland Ave
Your Personal Tour Guide
Ask me questions while you tour the home.