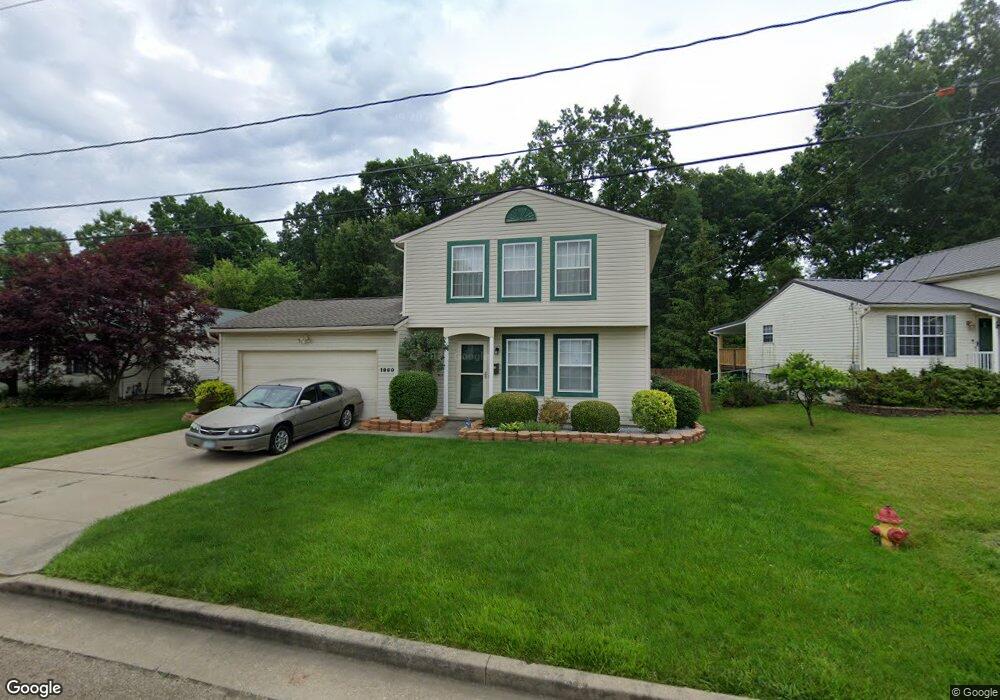
1860 Greentree Place SE Massillon, OH 44646
Downtown Massillon NeighborhoodEstimated Value: $119,245 - $217,000
3
Beds
1
Bath
1,104
Sq Ft
$147/Sq Ft
Est. Value
About This Home
This home is located at 1860 Greentree Place SE, Massillon, OH 44646 and is currently estimated at $162,311, approximately $147 per square foot. 1860 Greentree Place SE is a home located in Stark County with nearby schools including Massillon Intermediate School, Massillon Junior High School, and Washington High School.
Ownership History
Date
Name
Owned For
Owner Type
Purchase Details
Closed on
May 23, 2001
Sold by
Logan Evangolyn
Bought by
Logan Derrick
Current Estimated Value
Purchase Details
Closed on
Mar 19, 1999
Sold by
Seville Developers Inc
Bought by
Logan Derrick L and Logan Evangolyn I
Home Financials for this Owner
Home Financials are based on the most recent Mortgage that was taken out on this home.
Original Mortgage
$91,950
Interest Rate
6.8%
Mortgage Type
Purchase Money Mortgage
Create a Home Valuation Report for This Property
The Home Valuation Report is an in-depth analysis detailing your home's value as well as a comparison with similar homes in the area
Home Values in the Area
Average Home Value in this Area
Purchase History
| Date | Buyer | Sale Price | Title Company |
|---|---|---|---|
| Logan Derrick | -- | -- | |
| Logan Derrick L | $96,800 | -- |
Source: Public Records
Mortgage History
| Date | Status | Borrower | Loan Amount |
|---|---|---|---|
| Closed | Logan Derrick L | $91,950 |
Source: Public Records
Tax History Compared to Growth
Tax History
| Year | Tax Paid | Tax Assessment Tax Assessment Total Assessment is a certain percentage of the fair market value that is determined by local assessors to be the total taxable value of land and additions on the property. | Land | Improvement |
|---|---|---|---|---|
| 2025 | -- | $37,070 | $6,230 | $30,840 |
| 2024 | -- | $37,070 | $6,230 | $30,840 |
| 2023 | $1,599 | $31,260 | $7,600 | $23,660 |
| 2022 | $1,602 | $31,260 | $7,600 | $23,660 |
| 2021 | $1,628 | $31,260 | $7,600 | $23,660 |
| 2020 | $1,349 | $24,360 | $6,230 | $18,130 |
| 2019 | $1,330 | $24,360 | $6,230 | $18,130 |
| 2018 | $1,322 | $24,360 | $6,230 | $18,130 |
| 2017 | $1,237 | $21,290 | $5,430 | $15,860 |
| 2016 | $1,258 | $21,290 | $5,430 | $15,860 |
| 2015 | $1,243 | $21,290 | $5,430 | $15,860 |
| 2014 | $1,175 | $19,460 | $4,970 | $14,490 |
| 2013 | $592 | $19,460 | $4,970 | $14,490 |
Source: Public Records
Map
Nearby Homes
- Lot# 13 Candell Forest Ave St SE
- Lot#15 Candell St SE
- Lot#16 Candell St SE
- Lot 19 Candell St SE
- Lot# 18 Candell St SE
- Lot# 17 Candell St SE
- Lot# 14 Candell St SE
- Lot# 12 Candell St SE
- Lot# 11 Candell St SE
- Lot# 10 Candell St SE
- Lot# 9 Candell St SE
- Lot# 8 Candell St SE
- Lot# 7 Candell St SE
- Lot# 6 Candell St SE
- Lot# 5 Candell St SE
- Lot# 4 Candell St SE
- Lot# 3 Candell St SE
- Lot# 2 Candell St SE
- Lot 24 Candell Ave SW
- Lot# 1 Candell St SE
- 1850 Greentree Place SE
- 1870 Greentree Place SE
- 1840 Greentree Place SE
- 1880 Greentree Place SE
- 1865 Greentree Place SE
- 1855 Greentree Place SE
- 1830 Greentree Place SE
- 1875 Greentree Place SE
- 1845 Greentree Place SE
- 1890 Greentree Place SE
- 1885 Greentree Place SE
- 1820 Greentree Place SE
- 1835 Greentree Place SE
- 1895 Greentree Place SE
- 1850 Bloominghills Place SE
- 1890 Blooming Hills Place SE
- 1415 Forest Ave SE
- 1421 Forest Ave SE
- 1427 Forest Ave SE
- 1407 Forest Ave SE