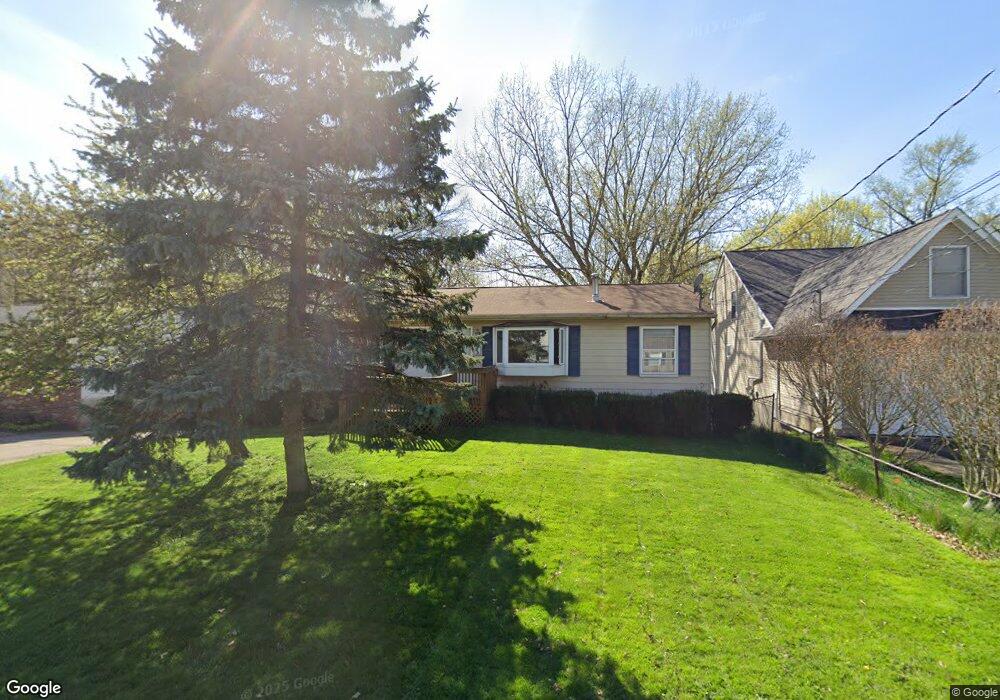
1860 Sedro St Unit 1862 Cuyahoga Falls, OH 44221
Northmoreland NeighborhoodEstimated Value: $230,000 - $246,000
4
Beds
2
Baths
1,534
Sq Ft
$157/Sq Ft
Est. Value
About This Home
This home is located at 1860 Sedro St Unit 1862, Cuyahoga Falls, OH 44221 and is currently estimated at $240,312, approximately $156 per square foot. 1860 Sedro St Unit 1862 is a home located in Summit County with nearby schools including Elizabeth Price Elementary School, Bolich Middle School, and Cuyahoga Falls High School.
Ownership History
Date
Name
Owned For
Owner Type
Purchase Details
Closed on
Dec 10, 2003
Sold by
Black William J
Bought by
Black William J and Black Jennifer L
Current Estimated Value
Home Financials for this Owner
Home Financials are based on the most recent Mortgage that was taken out on this home.
Original Mortgage
$120,000
Interest Rate
5.91%
Mortgage Type
Unknown
Purchase Details
Closed on
May 12, 2003
Sold by
Wilson Richard C and Wilson Janet M
Bought by
Black William J
Purchase Details
Closed on
Mar 14, 2001
Sold by
Wilson Richard C and Wilson Janet M
Bought by
Wilson Richard C and Wilson Janet M
Purchase Details
Closed on
Mar 27, 1997
Sold by
Robinson Gary G
Bought by
Wilson Richard C and Wilson Janet
Home Financials for this Owner
Home Financials are based on the most recent Mortgage that was taken out on this home.
Original Mortgage
$81,600
Interest Rate
7.38%
Mortgage Type
New Conventional
Create a Home Valuation Report for This Property
The Home Valuation Report is an in-depth analysis detailing your home's value as well as a comparison with similar homes in the area
Home Values in the Area
Average Home Value in this Area
Purchase History
| Date | Buyer | Sale Price | Title Company |
|---|---|---|---|
| Black William J | -- | Affinity Title Agency Inc | |
| Black William J | $130,000 | Affinity Title Agency | |
| Wilson Richard C | -- | -- | |
| Wilson Richard C | $34,000 | -- |
Source: Public Records
Mortgage History
| Date | Status | Borrower | Loan Amount |
|---|---|---|---|
| Open | Black William J | $175,000 | |
| Closed | Black William J | $160,000 | |
| Closed | Black William J | $120,000 | |
| Previous Owner | Wilson Richard C | $83,000 | |
| Previous Owner | Wilson Richard C | $81,600 |
Source: Public Records
Tax History Compared to Growth
Tax History
| Year | Tax Paid | Tax Assessment Tax Assessment Total Assessment is a certain percentage of the fair market value that is determined by local assessors to be the total taxable value of land and additions on the property. | Land | Improvement |
|---|---|---|---|---|
| 2025 | $3,717 | $65,706 | $11,018 | $54,688 |
| 2024 | $3,717 | $65,706 | $11,018 | $54,688 |
| 2023 | $3,717 | $65,706 | $11,018 | $54,688 |
| 2022 | $3,113 | $45,826 | $8,285 | $37,541 |
| 2021 | $3,189 | $45,826 | $8,285 | $37,541 |
| 2020 | $3,337 | $49,930 | $8,290 | $41,640 |
| 2019 | $3,003 | $40,920 | $7,460 | $33,460 |
| 2018 | $2,597 | $40,920 | $7,460 | $33,460 |
| 2017 | $2,353 | $40,920 | $7,460 | $33,460 |
| 2016 | $2,355 | $38,040 | $7,460 | $30,580 |
| 2015 | $2,353 | $38,040 | $7,460 | $30,580 |
| 2014 | $2,354 | $38,040 | $7,460 | $30,580 |
| 2013 | $2,537 | $41,340 | $7,460 | $33,880 |
Source: Public Records
Map
Nearby Homes
- 1704 Northmoreland Blvd
- 1512 Treasch Dr
- 1921 Dwight St
- 1995 Sedro St
- 1880 Issaquah St
- 1764 Hanover St
- 2079 Bailey Rd
- 965 Elizabeth Ct
- 2221 Suncrest Dr
- 1452 Buckingham Gate Blvd
- 2020 Deming St
- 1514 Wellingshire Cir Unit 38B
- 2375 Plymouth Ln
- 2289 Bailey Rd
- 721 Myrtle Ave
- 1444 Wellingshire Cir Unit 32B
- 1420 Wellingshire Cir Unit 23C
- 1491 Munroe Falls Ave
- 1251 Bailey Rd
- 1276 Bailey Rd
- 1860 Sedro St Unit 1862
- 1854 Sedro St Unit 1856
- 1856 Sedro St
- 1872 Sedro St
- 1840 Sedro St
- 1855 Olympic St
- 1878 Sedro St
- 1863 Olympic St
- 1824 Sedro St
- 1841 Olympic St
- 1845 Olympic St
- 1853 Sedro St Unit 1855
- 1871 Olympic St
- 1843 Sedro St Unit 1845
- 1863 Sedro St Unit 1865
- 1839 Olympic St
- 1837 Olympic St Unit 1839
- 1837 1839 Olympic St
- 1820 Sedro St
- 1837 Sedro St