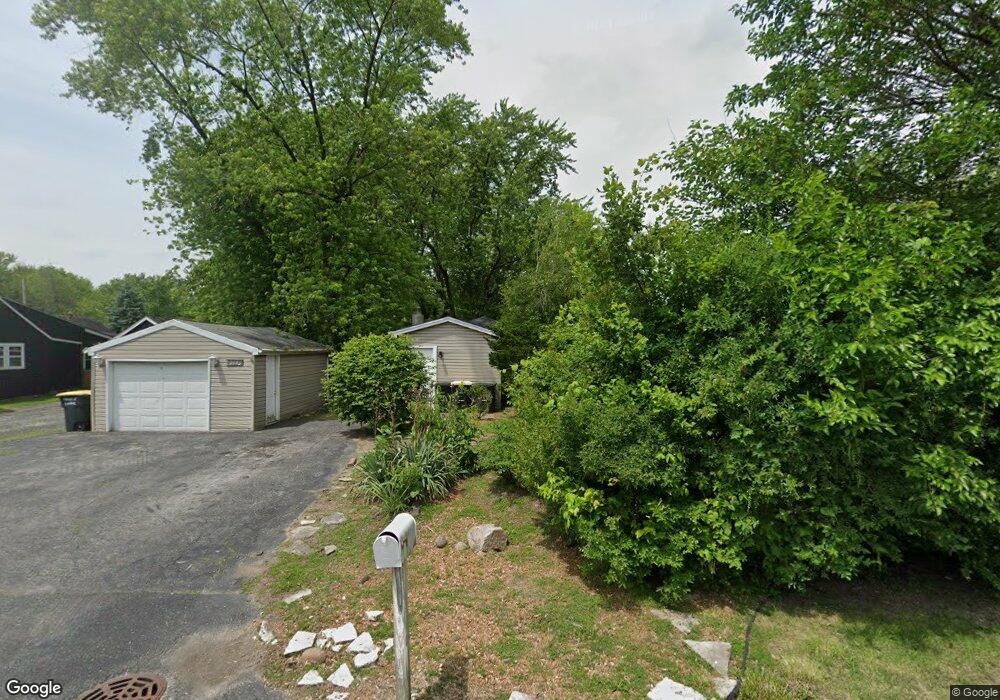
18602 Oak Ave Lansing, IL 60438
Estimated Value: $152,460 - $198,000
2
Beds
1
Bath
864
Sq Ft
$198/Sq Ft
Est. Value
About This Home
This home is located at 18602 Oak Ave, Lansing, IL 60438 and is currently estimated at $170,865, approximately $197 per square foot. 18602 Oak Ave is a home located in Cook County with nearby schools including Nathan Hale Elementary School, Heritage Middle School, and Thornton Fractnl So High School.
Ownership History
Date
Name
Owned For
Owner Type
Purchase Details
Closed on
Jun 15, 2019
Sold by
Reppa Tim and Reppa Megan
Bought by
Transzland Llc
Current Estimated Value
Home Financials for this Owner
Home Financials are based on the most recent Mortgage that was taken out on this home.
Original Mortgage
$90,000
Outstanding Balance
$78,637
Interest Rate
4.1%
Mortgage Type
Construction
Estimated Equity
$92,228
Purchase Details
Closed on
Aug 17, 2009
Sold by
Yonker Todd M
Bought by
Reppa Tim
Home Financials for this Owner
Home Financials are based on the most recent Mortgage that was taken out on this home.
Original Mortgage
$86,853
Interest Rate
5.27%
Mortgage Type
FHA
Purchase Details
Closed on
Aug 31, 1998
Sold by
Hawk Shann T
Bought by
Yonker Todd M
Home Financials for this Owner
Home Financials are based on the most recent Mortgage that was taken out on this home.
Original Mortgage
$87,350
Interest Rate
7.02%
Mortgage Type
FHA
Create a Home Valuation Report for This Property
The Home Valuation Report is an in-depth analysis detailing your home's value as well as a comparison with similar homes in the area
Home Values in the Area
Average Home Value in this Area
Purchase History
| Date | Buyer | Sale Price | Title Company |
|---|---|---|---|
| Transzland Llc | $75,000 | Fidelity National Title | |
| Reppa Tim | $90,000 | Pntn | |
| Yonker Todd M | $88,000 | -- |
Source: Public Records
Mortgage History
| Date | Status | Borrower | Loan Amount |
|---|---|---|---|
| Open | Transzland Llc | $90,000 | |
| Previous Owner | Reppa Tim | $86,853 | |
| Previous Owner | Yonker Todd M | $87,350 |
Source: Public Records
Tax History
| Year | Tax Paid | Tax Assessment Tax Assessment Total Assessment is a certain percentage of the fair market value that is determined by local assessors to be the total taxable value of land and additions on the property. | Land | Improvement |
|---|---|---|---|---|
| 2025 | $4,510 | $10,573 | $2,454 | $8,119 |
| 2024 | $4,510 | $10,573 | $2,454 | $8,119 |
| 2023 | $4,103 | $10,573 | $2,454 | $8,119 |
| 2022 | $4,103 | $6,990 | $4,601 | $2,389 |
| 2021 | $3,955 | $6,989 | $4,600 | $2,389 |
| 2020 | $3,701 | $6,989 | $4,600 | $2,389 |
| 2019 | $2,749 | $8,747 | $4,293 | $4,454 |
| 2018 | $2,671 | $8,747 | $4,293 | $4,454 |
| 2017 | $2,645 | $8,747 | $4,293 | $4,454 |
| 2016 | $2,903 | $8,554 | $3,987 | $4,567 |
| 2015 | $2,755 | $8,554 | $3,987 | $4,567 |
| 2014 | $2,716 | $8,554 | $3,987 | $4,567 |
| 2013 | $2,913 | $9,705 | $3,987 | $5,718 |
Source: Public Records
Map
Nearby Homes
- 18559 Escanaba Ave Unit 201
- 18446 Glen Oak Ave
- 18550 Torrence Ave Unit 19
- 18550 Torrence Ave Unit 5
- 2340 186th St Unit 7
- 18340 Glen Oak Ave Unit 1D
- 18340 Glen Oak Ave Unit 3C
- 18235 Exchange Ave
- 18331 Hickory St
- 18655 Oakwood Ave
- 18514 Ridgewood Ave
- 2621 Ridge Rd
- 2852 189th St
- 2643 Ridge Rd
- 18964 Wildwood Ave
- 2616 Ridge Rd
- 2918 188th Place
- 18549 Olde Farm Rd
- 2809 Forest Ln
- 18309 Bock Rd
- 18614 Oak Ave
- 2461 186th St
- 18650 Oak Ave
- 2455 186th St
- 2460 186th Place
- 18542 Oak Ave
- 2456 186th Place
- 18538 Oak Ave
- 2449 186th St
- 18539 Oak Ave
- 18534 Oak Ave
- 18535 Oak Ave
- 2443 186th St
- 2463 186th Place
- 2463 186th Place
- 18530 Oak Ave
- 2440 186th St
- 2440 186th St Unit I2
- 2440 186th St Unit A1
- 2440 186th St Unit J1
Your Personal Tour Guide
Ask me questions while you tour the home.