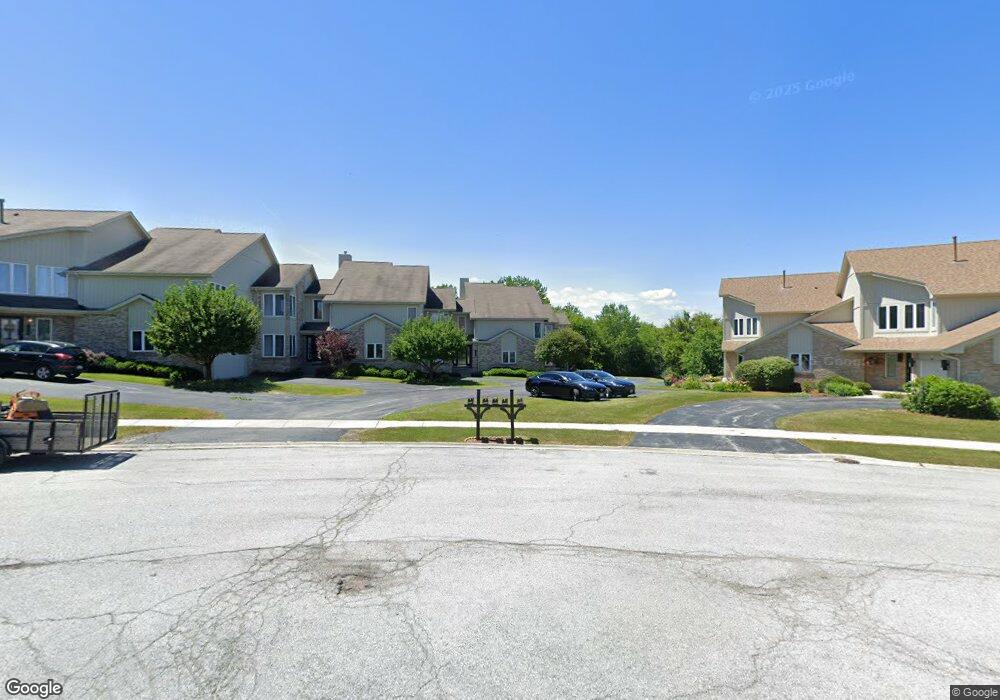
18604 Emily Ct Unit 22 Hazel Crest, IL 60429
Village West NeighborhoodEstimated Value: $172,000 - $294,000
Studio
--
Bath
4,880
Sq Ft
$52/Sq Ft
Est. Value
About This Home
This home is located at 18604 Emily Ct Unit 22, Hazel Crest, IL 60429 and is currently estimated at $252,214, approximately $51 per square foot. 18604 Emily Ct Unit 22 is a home located in Cook County with nearby schools including Flossmoor Hills Elementary School, Parker Junior High School, and Homewood-Flossmoor High School.
Ownership History
Date
Name
Owned For
Owner Type
Purchase Details
Closed on
Jan 25, 2006
Sold by
Chapman Shirley T
Bought by
Chapman Shirley T and Chapman Michael
Current Estimated Value
Purchase Details
Closed on
Aug 19, 2005
Sold by
Blaylock Claudell A and Blaylock Rachel M
Bought by
Chapman Shirley T
Home Financials for this Owner
Home Financials are based on the most recent Mortgage that was taken out on this home.
Original Mortgage
$204,800
Outstanding Balance
$106,647
Interest Rate
5.82%
Mortgage Type
Fannie Mae Freddie Mac
Estimated Equity
$145,567
Purchase Details
Closed on
Jul 14, 1998
Sold by
Vs Management Of Hazel Crest Inc
Bought by
Blaylock Claudell A and Blayclock Rachel M
Home Financials for this Owner
Home Financials are based on the most recent Mortgage that was taken out on this home.
Original Mortgage
$158,330
Interest Rate
6.98%
Create a Home Valuation Report for This Property
The Home Valuation Report is an in-depth analysis detailing your home's value as well as a comparison with similar homes in the area
Home Values in the Area
Average Home Value in this Area
Purchase History
| Date | Buyer | Sale Price | Title Company |
|---|---|---|---|
| Chapman Shirley T | -- | None Available | |
| Chapman Shirley T | $256,000 | Cti | |
| Blaylock Claudell A | $233,000 | -- |
Source: Public Records
Mortgage History
| Date | Status | Borrower | Loan Amount |
|---|---|---|---|
| Open | Chapman Shirley T | $204,800 | |
| Previous Owner | Blaylock Claudell A | $158,330 |
Source: Public Records
Tax History
| Year | Tax Paid | Tax Assessment Tax Assessment Total Assessment is a certain percentage of the fair market value that is determined by local assessors to be the total taxable value of land and additions on the property. | Land | Improvement |
|---|---|---|---|---|
| 2025 | $9,544 | $24,060 | $3,941 | $20,119 |
| 2024 | $9,544 | $24,060 | $3,941 | $20,119 |
| 2023 | $3,765 | $24,060 | $3,941 | $20,119 |
| 2022 | $3,765 | $11,348 | $3,468 | $7,880 |
| 2021 | $2,828 | $11,347 | $3,468 | $7,879 |
| 2020 | $2,465 | $11,347 | $3,468 | $7,879 |
| 2019 | $2,822 | $13,513 | $3,310 | $10,203 |
| 2018 | $2,718 | $13,513 | $3,310 | $10,203 |
| 2017 | $4,720 | $13,513 | $3,310 | $10,203 |
| 2016 | $3,916 | $11,186 | $3,152 | $8,034 |
| 2015 | $4,054 | $11,186 | $3,152 | $8,034 |
| 2014 | $3,978 | $11,186 | $3,152 | $8,034 |
| 2013 | $6,243 | $16,374 | $3,152 | $13,222 |
Source: Public Records
Map
Nearby Homes
- 18600 Village West Dr Unit 310
- 18600 Village West Dr Unit 303
- 3710 Briar Ln
- 3800 River Rd
- 754 Central Park Ave
- 3641 Beech St
- 3314 185th Place
- 3600 183rd St
- 3360 184th St Unit 3W
- 3360 184th St Unit 1E
- 3712 Beech St
- 3902 Edgewater Dr
- 835 Maple Rd
- 18424 Kedzie Ave Unit 2A
- 3207 184th St Unit 1A
- 4036 W 187th St
- 4445 Provincetown Dr
- 18445 Kedzie Ave
- 18107 Kedzie Ave
- 3406 Seine Ct
- 18602 Emily Ct Unit 23
- 18606 Emily Ct Unit 21
- 18608 Emily Ct Unit 20
- 18607 Emily Ct Unit 28
- 18610 Emily Ct Unit 19
- 18605 Emily Ct Unit 27
- 18603 Emily Ct Unit 26
- 18609 Emily Ct Unit 29
- 18611 Emily Ct Unit 30
- 18615 Emily Ct Unit 32
- 18601 Emily Ct Unit 25
- 18630 Emily Ct Unit 18
- 18613 Emily Ct Unit 31
- 18632 Emily Ct Unit 17
- 18513 River Rd
- 3602 Roberts Ct Unit 15
- 3600 Roberts Ct Unit 16
- 3603 River Rd
Your Personal Tour Guide
Ask me questions while you tour the home.