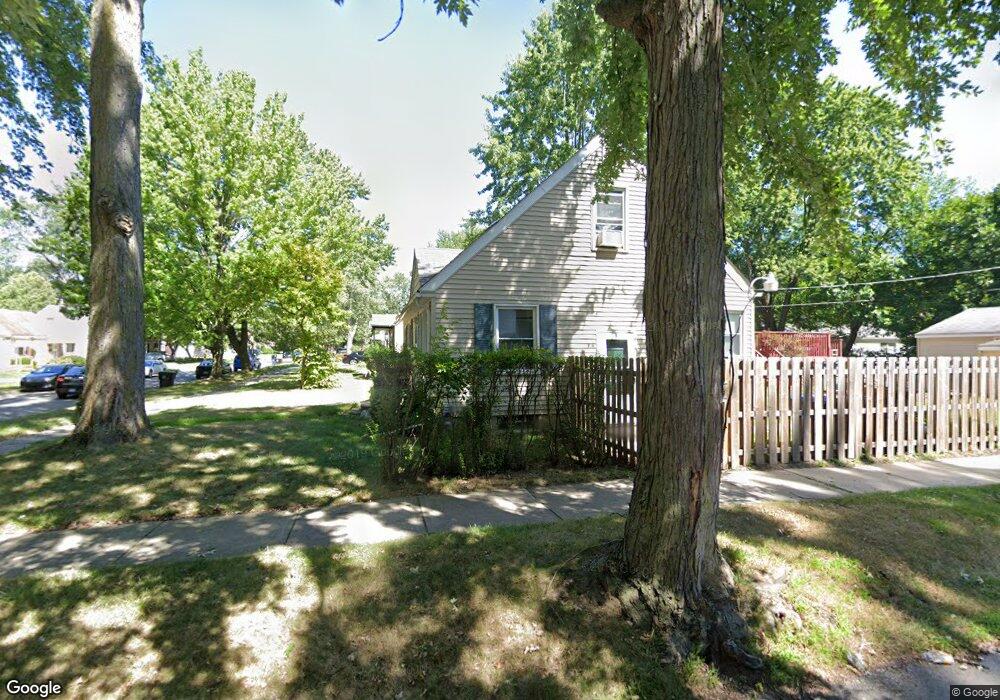
18606 Dalby Unit Bldg-Unit Redford, MI 48240
Estimated Value: $178,000 - $239,000
--
Bed
2
Baths
1,200
Sq Ft
$173/Sq Ft
Est. Value
About This Home
This home is located at 18606 Dalby Unit Bldg-Unit, Redford, MI 48240 and is currently estimated at $208,176, approximately $173 per square foot. 18606 Dalby Unit Bldg-Unit is a home located in Wayne County with nearby schools including Beech Elementary School, Hilbert Middle School, and Redford Union High School.
Ownership History
Date
Name
Owned For
Owner Type
Purchase Details
Closed on
Jun 29, 2018
Sold by
Campera Chris
Bought by
Morgan Nikkita
Current Estimated Value
Home Financials for this Owner
Home Financials are based on the most recent Mortgage that was taken out on this home.
Original Mortgage
$107,825
Outstanding Balance
$93,446
Interest Rate
4.5%
Mortgage Type
New Conventional
Estimated Equity
$114,730
Purchase Details
Closed on
Sep 26, 2011
Sold by
Donovan Shaun
Bought by
Camper Chris
Purchase Details
Closed on
Aug 1, 2011
Sold by
James B Nutter & Company
Bought by
The Secretary Of Housing & Urban Develop
Purchase Details
Closed on
Jan 5, 2011
Sold by
Cranston Jason L and Cranston Jennifer E
Bought by
James B Nutter & Company
Purchase Details
Closed on
Apr 30, 2001
Sold by
Cobb Leslie J
Bought by
Cranston Jason L
Create a Home Valuation Report for This Property
The Home Valuation Report is an in-depth analysis detailing your home's value as well as a comparison with similar homes in the area
Home Values in the Area
Average Home Value in this Area
Purchase History
| Date | Buyer | Sale Price | Title Company |
|---|---|---|---|
| Morgan Nikkita | $113,500 | Red Carpet Title Agency Llc | |
| Camper Chris | $20,500 | None Available | |
| The Secretary Of Housing & Urban Develop | -- | None Available | |
| James B Nutter & Company | $130,561 | None Available | |
| Cranston Jason L | $132,900 | -- |
Source: Public Records
Mortgage History
| Date | Status | Borrower | Loan Amount |
|---|---|---|---|
| Open | Morgan Nikkita | $107,825 |
Source: Public Records
Tax History Compared to Growth
Tax History
| Year | Tax Paid | Tax Assessment Tax Assessment Total Assessment is a certain percentage of the fair market value that is determined by local assessors to be the total taxable value of land and additions on the property. | Land | Improvement |
|---|---|---|---|---|
| 2025 | $1,295 | $91,500 | $0 | $0 |
| 2024 | $1,295 | $83,800 | $0 | $0 |
| 2023 | $1,235 | $68,700 | $0 | $0 |
| 2022 | $2,963 | $59,300 | $0 | $0 |
| 2021 | $3,785 | $53,800 | $0 | $0 |
| 2020 | $2,840 | $45,300 | $0 | $0 |
| 2019 | $2,777 | $42,300 | $0 | $0 |
| 2018 | $768 | $30,400 | $0 | $0 |
| 2017 | $2,818 | $29,500 | $0 | $0 |
| 2016 | $2,183 | $29,900 | $0 | $0 |
| 2015 | $2,710 | $27,100 | $0 | $0 |
| 2013 | $2,680 | $27,900 | $0 | $0 |
| 2012 | $1,690 | $28,800 | $8,400 | $20,400 |
Source: Public Records
Map
Nearby Homes