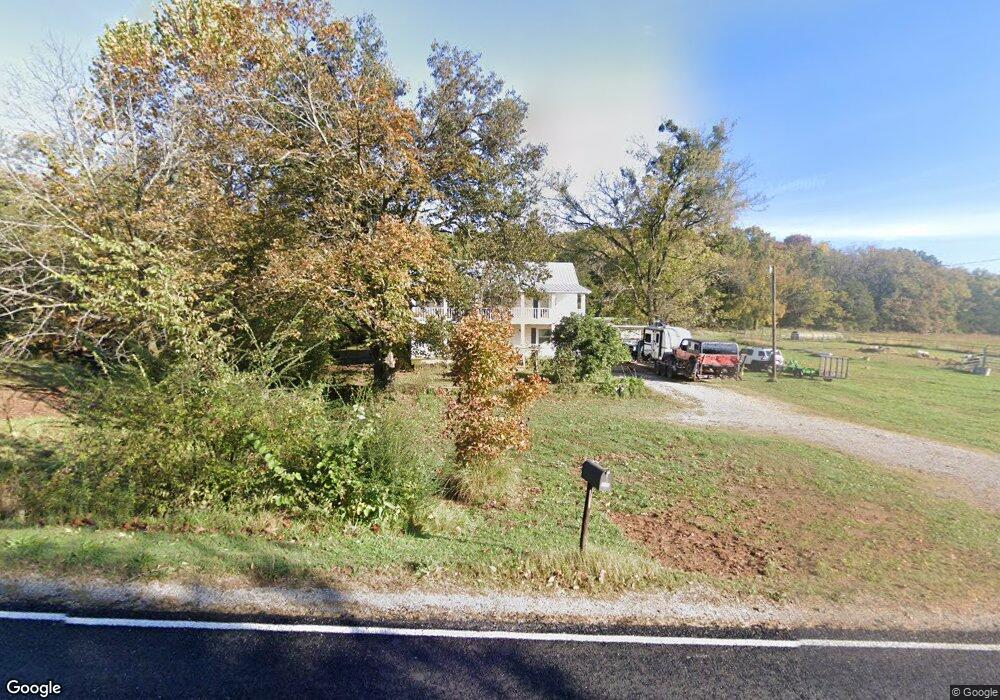
18608 E Black Oak Rd Fayetteville, AR 72701
Estimated Value: $342,188 - $462,000
--
Bed
2
Baths
2,170
Sq Ft
$179/Sq Ft
Est. Value
About This Home
This home is located at 18608 E Black Oak Rd, Fayetteville, AR 72701 and is currently estimated at $388,063, approximately $178 per square foot. 18608 E Black Oak Rd is a home located in Washington County with nearby schools including Elkins Elementary Primary School, Elkins Elementary School, and Elkins Middle School.
Ownership History
Date
Name
Owned For
Owner Type
Purchase Details
Closed on
May 30, 2013
Sold by
Harrelson Jimmy Lee and Harrelson Mary Faye
Bought by
Baldwin Jon F and Mcneely Emily Rae
Current Estimated Value
Home Financials for this Owner
Home Financials are based on the most recent Mortgage that was taken out on this home.
Original Mortgage
$195,000
Outstanding Balance
$137,868
Interest Rate
3.43%
Mortgage Type
New Conventional
Estimated Equity
$250,195
Purchase Details
Closed on
May 27, 2013
Bought by
Turner Alma Faye and Harrelson Jimm
Home Financials for this Owner
Home Financials are based on the most recent Mortgage that was taken out on this home.
Original Mortgage
$195,000
Outstanding Balance
$137,868
Interest Rate
3.43%
Mortgage Type
New Conventional
Estimated Equity
$250,195
Purchase Details
Closed on
Jun 20, 1986
Bought by
Turner David E and Turner Alma F
Create a Home Valuation Report for This Property
The Home Valuation Report is an in-depth analysis detailing your home's value as well as a comparison with similar homes in the area
Home Values in the Area
Average Home Value in this Area
Purchase History
| Date | Buyer | Sale Price | Title Company |
|---|---|---|---|
| Baldwin Jon F | $220,000 | Lenders Title Company | |
| Turner Alma Faye | -- | -- | |
| Turner David E | $40,000 | -- |
Source: Public Records
Mortgage History
| Date | Status | Borrower | Loan Amount |
|---|---|---|---|
| Open | Baldwin Jon F | $195,000 |
Source: Public Records
Tax History Compared to Growth
Tax History
| Year | Tax Paid | Tax Assessment Tax Assessment Total Assessment is a certain percentage of the fair market value that is determined by local assessors to be the total taxable value of land and additions on the property. | Land | Improvement |
|---|---|---|---|---|
| 2025 | $1,036 | $48,560 | $9,380 | $39,180 |
| 2024 | $1,066 | $48,560 | $9,380 | $39,180 |
| 2023 | $1,107 | $48,560 | $9,380 | $39,180 |
| 2022 | $1,087 | $32,990 | $4,980 | $28,010 |
| 2021 | $1,025 | $32,990 | $4,980 | $28,010 |
| 2020 | $962 | $32,990 | $4,980 | $28,010 |
| 2019 | $906 | $25,220 | $3,910 | $21,310 |
| 2018 | $907 | $25,220 | $3,910 | $21,310 |
| 2017 | $840 | $25,220 | $3,910 | $21,310 |
| 2016 | $791 | $25,220 | $3,910 | $21,310 |
| 2015 | $739 | $25,220 | $3,910 | $21,310 |
| 2014 | $1,037 | $20,610 | $3,430 | $17,180 |
Source: Public Records
Map
Nearby Homes
- 19105 Feather Hill Rd
- 10030 N Whitehouse Rd
- 10088 S Whitehouse Rd
- Tract 3a Downing Rd
- Tract 1a Downing Rd
- Tract 2b Downing Rd
- Tract 2a Downing Rd
- Tract 1b Downing Rd
- 136 Downing (Wc) Rd
- 503 Jason St
- 607 Jason St
- 517 Jason St
- 10836 Bray Rd
- 10703 Thunder Rd
- 567 Jason St
- 11724 Brubaker Rd
- 19641 Conestoga Rd
- 20553 Durham McCord Rd
- 20266 Mount Olive Rd
- 1036 Adysen Ln
- 18578 E Black Oak Rd
- 18662 E Black Oak Rd
- 18488 E Black Oak Rd
- 18501 E Black Oak Rd
- 18288 E Black Oak Rd
- 1623 Mt Salem Cemetery Rd
- 0 Salem Cemetary Rd
- 0 E Black Oak 5a Rd Unit 659669
- 10671 Salem Cemetery Rd
- 18784 E Black Oak Rd
- 18690 E Black Oak Rd
- 18239 E Black Oak Rd
- 10599 Salem Cemetery Rd
- 18821 E Black Oak Rd
- 18703 E Black Oak Rd
- 18859 Black Oak Rd
- 10631 Salem Cemetery Rd
- 18204 E Black Oak Rd
- 18177 E Black Oak Rd