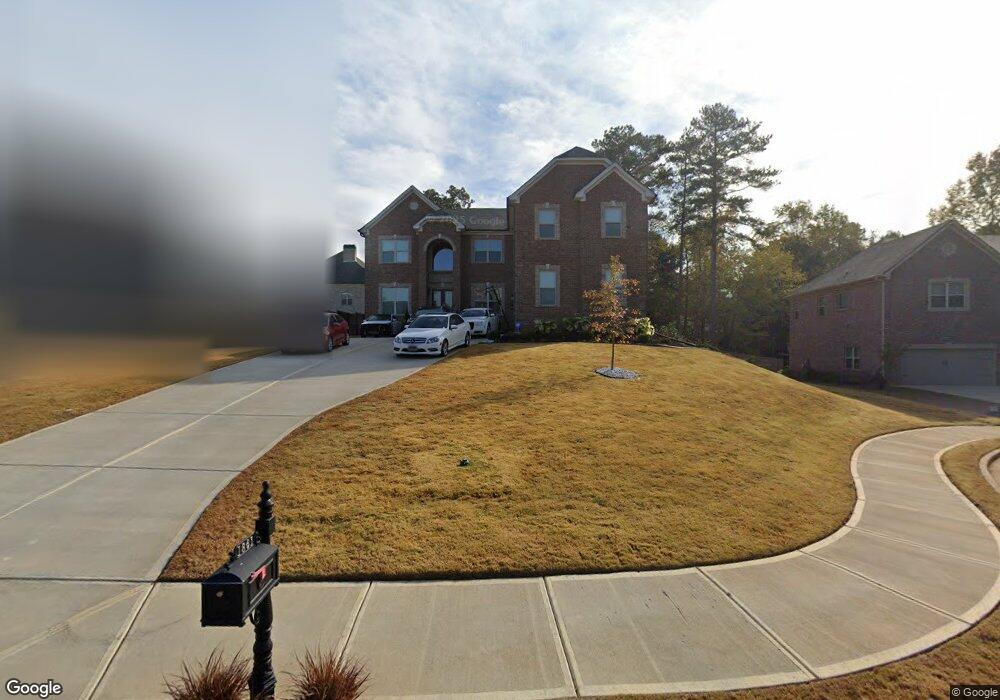
1861 Christopher Dr Unit 19 Conyers, GA 30094
Estimated Value: $538,000 - $626,000
5
Beds
5
Baths
3,475
Sq Ft
$164/Sq Ft
Est. Value
About This Home
This home is located at 1861 Christopher Dr Unit 19, Conyers, GA 30094 and is currently estimated at $570,767, approximately $164 per square foot. 1861 Christopher Dr Unit 19 is a home located in Rockdale County with nearby schools including Flat Shoals Elementary School, Edwards Middle School, and Salem High School.
Ownership History
Date
Name
Owned For
Owner Type
Purchase Details
Closed on
Oct 20, 2023
Sold by
Almestica Karen
Bought by
Flex Fi911
Current Estimated Value
Purchase Details
Closed on
Feb 12, 2021
Sold by
Green River Builders Inc
Bought by
Parson Corren A and Almestica Karen A
Home Financials for this Owner
Home Financials are based on the most recent Mortgage that was taken out on this home.
Original Mortgage
$420,074
Interest Rate
2.7%
Mortgage Type
FHA
Purchase Details
Closed on
Sep 21, 2020
Sold by
S A Goodsell Development Co
Bought by
Green River Builders Inc
Home Financials for this Owner
Home Financials are based on the most recent Mortgage that was taken out on this home.
Original Mortgage
$260,800
Interest Rate
2.9%
Mortgage Type
New Conventional
Purchase Details
Closed on
Jun 25, 2014
Sold by
Conyers Lots Llc
Bought by
Sonj Builders Llc and O Gpf C
Purchase Details
Closed on
Nov 27, 2012
Sold by
Cal Christopher Drive Lots
Bought by
Conyers Lots Llc
Purchase Details
Closed on
Jul 3, 2012
Sold by
Federal Deposit Insurance Corporation
Bought by
Cal Christopher Drive Lots Llc and C/O Sabal Financial Grp Lp
Create a Home Valuation Report for This Property
The Home Valuation Report is an in-depth analysis detailing your home's value as well as a comparison with similar homes in the area
Home Values in the Area
Average Home Value in this Area
Purchase History
| Date | Buyer | Sale Price | Title Company |
|---|---|---|---|
| Flex Fi911 | $557,000 | -- | |
| Parson Corren A | $429,900 | -- | |
| Green River Builders Inc | $48,000 | -- | |
| Sonj Builders Llc | $257,500 | -- | |
| Conyers Lots Llc | $130,000 | -- | |
| Cal Christopher Drive Lots Llc | -- | -- |
Source: Public Records
Mortgage History
| Date | Status | Borrower | Loan Amount |
|---|---|---|---|
| Previous Owner | Parson Corren A | $420,074 | |
| Previous Owner | Green River Builders Inc | $260,800 |
Source: Public Records
Tax History Compared to Growth
Tax History
| Year | Tax Paid | Tax Assessment Tax Assessment Total Assessment is a certain percentage of the fair market value that is determined by local assessors to be the total taxable value of land and additions on the property. | Land | Improvement |
|---|---|---|---|---|
| 2024 | $6,766 | $267,960 | $58,760 | $209,200 |
| 2023 | $5,501 | $227,600 | $56,400 | $171,200 |
| 2022 | $4,187 | $175,160 | $34,600 | $140,560 |
| 2021 | $5,158 | $127,200 | $32,800 | $94,400 |
| 2020 | $512 | $11,000 | $11,000 | $0 |
| 2019 | $537 | $11,000 | $11,000 | $0 |
| 2018 | $530 | $16,480 | $16,480 | $0 |
| 2017 | $853 | $17,800 | $17,800 | $0 |
| 2016 | $853 | $17,800 | $17,800 | $0 |
| 2015 | $512 | $10,300 | $10,300 | $0 |
| 2014 | $227 | $4,000 | $4,000 | $0 |
| 2013 | -- | $6,800 | $6,800 | $0 |
Source: Public Records
Map
Nearby Homes
- 1920 Logan Ln
- 917 Curry Cir SE
- 2924 Raintree Dr SE
- 1813 Holmsey Cir
- 2923 Raintree Dr SE
- 693 Deering Rd SE
- 2537 Lennox Rd SE
- 820 Bridgewater Way SE
- 2608 Downing Park Dr SE
- 2717 Stanton Woods Dr SE
- 784 Stieff Ct SE
- 812 Raintree Way SE
- 2754 Harvest Dr SE
- 574 Almand Branch Rd SE Unit 1
- 2684 Harvest Dr SE
- 665 Huron Ct SE
- 1511 Hillside Dr SE
- 726 Shoreline Trail SE
- 1508 Hillside Dr SE
- 2987 Landmark Dr SE
- 1861 Christopher Dr
- 1857 Christopher Dr
- 1857 Christopher Dr Unit 20
- 1873 Christopher Dr
- 1873 Christopher Dr Unit 18
- 1853 Christopher Dr
- 902 Oregano Ct SE
- 904 Oregano Ct SE Unit 2
- 900 Oregano Ct SE Unit 2
- 1866 Christopher Dr
- 1849 Christopher Dr
- 1849 Christopher Dr Unit 22
- 906 Oregano Ct SE Unit 2
- 1858 Christopher Dr Unit 14
- 1858 Christopher Dr
- 1854 Christopher Dr Unit 329
- 1854 Christopher Dr
- 0 Oregano Ct SE Unit 7328292
- 0 Oregano Ct SE Unit 8697435
- 0 Oregano Ct SE