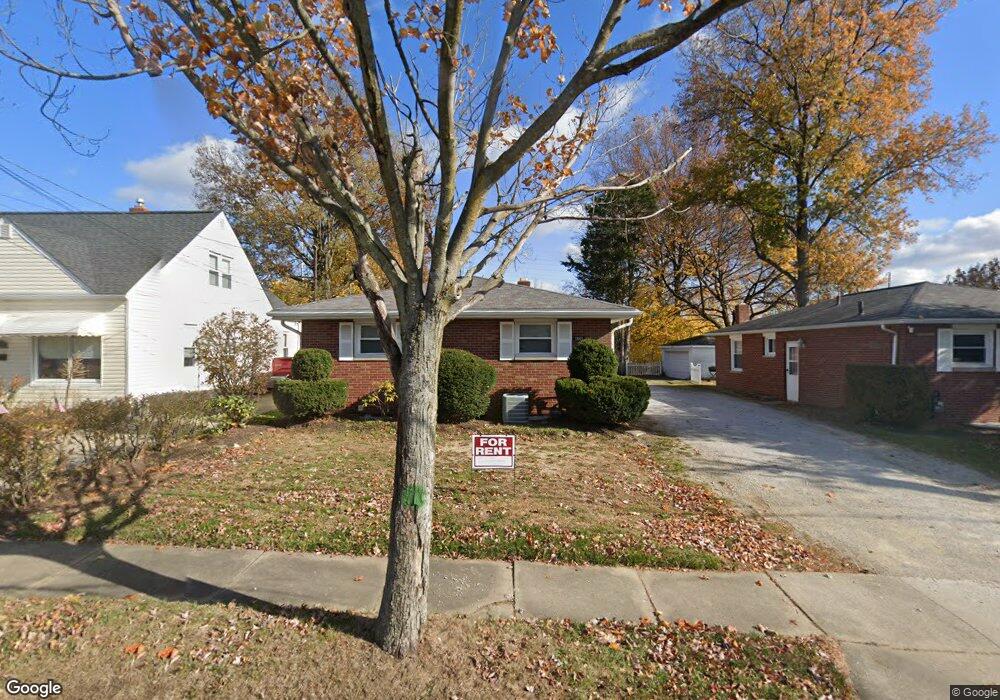
1861 Highview Ave Unit 1863 Akron, OH 44301
Firestone Park NeighborhoodEstimated Value: $174,349 - $221,000
4
Beds
2
Baths
1,485
Sq Ft
$129/Sq Ft
Est. Value
About This Home
This home is located at 1861 Highview Ave Unit 1863, Akron, OH 44301 and is currently estimated at $191,587, approximately $129 per square foot. 1861 Highview Ave Unit 1863 is a home located in Summit County with nearby schools including Kenmore Garfield Community Learning Center, Eagle Elementary, and Main Preparatory Academy.
Ownership History
Date
Name
Owned For
Owner Type
Purchase Details
Closed on
Nov 2, 2023
Sold by
Nguyen Ngoc Anh T
Bought by
Taylor Bernard D
Current Estimated Value
Home Financials for this Owner
Home Financials are based on the most recent Mortgage that was taken out on this home.
Original Mortgage
$187,304
Outstanding Balance
$182,460
Interest Rate
7.19%
Mortgage Type
FHA
Estimated Equity
$9,127
Purchase Details
Closed on
Jun 16, 2022
Sold by
Jhdc Properties Llc
Bought by
Nguyen Ngoc Anh T
Purchase Details
Closed on
Dec 1, 2015
Sold by
Truax Constance A
Bought by
Jhdc Properties Llc
Purchase Details
Closed on
Apr 8, 1999
Sold by
Gruity Dorothy
Bought by
Wathey Ernest F
Home Financials for this Owner
Home Financials are based on the most recent Mortgage that was taken out on this home.
Original Mortgage
$79,959
Interest Rate
7.1%
Mortgage Type
FHA
Create a Home Valuation Report for This Property
The Home Valuation Report is an in-depth analysis detailing your home's value as well as a comparison with similar homes in the area
Home Values in the Area
Average Home Value in this Area
Purchase History
We collect this data history from publicly available records. To have your information removed, we recommend requesting removal directly through your county’s website.
| Date | Buyer | Sale Price | Title Company |
|---|---|---|---|
| Taylor Bernard D | $190,760 | American Title | |
| Nguyen Ngoc Anh T | $152,000 | Chicago Title | |
| Jhdc Properties Llc | $82,000 | Attorney | |
| Wathey Ernest F | $80,000 | Midland Commerce Group |
Source: Public Records
Mortgage History
We collect this data history from publicly available records. To have your information removed, we recommend requesting removal directly through your county’s website.
| Date | Status | Borrower | Loan Amount |
|---|---|---|---|
| Open | Taylor Bernard D | $187,304 | |
| Previous Owner | Wathey Ernest F | $79,959 |
Source: Public Records
Tax History
| Year | Tax Paid | Tax Assessment Tax Assessment Total Assessment is a certain percentage of the fair market value that is determined by local assessors to be the total taxable value of land and additions on the property. | Land | Improvement |
|---|---|---|---|---|
| 2026 | $5,929 | $50,656 | $8,026 | $42,630 |
| 2025 | $2,732 | $50,656 | $8,026 | $42,630 |
| 2024 | $2,732 | $50,656 | $8,026 | $42,630 |
| 2023 | $2,732 | $50,656 | $8,026 | $42,630 |
| 2022 | $2,524 | $36,708 | $5,817 | $30,891 |
| 2021 | $2,526 | $36,708 | $5,817 | $30,891 |
| 2020 | $2,489 | $36,710 | $5,820 | $30,890 |
| 2019 | $2,151 | $28,700 | $5,820 | $22,880 |
| 2018 | $2,123 | $28,700 | $5,820 | $22,880 |
| 2017 | $2,157 | $28,700 | $5,820 | $22,880 |
| 2016 | $2,159 | $28,700 | $5,820 | $22,880 |
| 2015 | $2,157 | $33,390 | $5,820 | $27,570 |
| 2014 | $2,478 | $33,390 | $5,820 | $27,570 |
| 2013 | $2,427 | $33,390 | $5,820 | $27,570 |
Source: Public Records
Map
Nearby Homes
- 1883 Highview Ave
- 1699 Sunset Ave
- 435 Selden Ave
- 1701 Brown St
- 604 S Firestone Blvd
- 687 E Catawba Ave
- 355 E Dresden Ave
- 715 E Catawba Ave
- 0 Woodview Dr
- 682 Barbara Ave
- 801 Chaffin Rd
- 554 Hastings Ct
- 1588 Highview Ave
- 523 Seaton Ct
- 1616 Greenlawn Ave
- 1570 Oakwood Ave
- 2152 Thornbury Ln
- 270 E Ralston Ave
- 457 S Firestone Blvd
- 1633 Glenmount Ave
- 1861 & 1863 Highview Ave
- 1861 1863 Highview Ave
- 1867 Highview Ave
- 1859 Highview Ave
- 1863 Highview Ave
- 578 Lurie Ave Unit 580
- 1873 Highview Ave
- 1844 Coventry St
- 590 Lurie Ave Unit 592
- 1864 Highview Ave
- 1868 Highview Ave
- 1858 Highview Ave
- 1878 Highview Ave
- 1841 Highview Ave
- 1856 Coventry St
- 585 Lurie Ave Unit 587
- 587 Lurie Ave
- 1835 Highview Ave
- 1887 Highview Ave Unit 1889
- 1884 Highview Ave Unit 1886
Your Personal Tour Guide
Ask me questions while you tour the home.