1861 Pinewood Ln Painesville, OH 44077
Estimated Value: $384,000 - $424,000
4
Beds
4
Baths
2,779
Sq Ft
$143/Sq Ft
Est. Value
About This Home
This home is located at 1861 Pinewood Ln, Painesville, OH 44077 and is currently estimated at $397,986, approximately $143 per square foot. 1861 Pinewood Ln is a home located in Lake County with nearby schools including Henry F. Lamuth Middle School, Riverside Junior/Senior High School, and Our Shepherd Lutheran School.
Ownership History
Date
Name
Owned For
Owner Type
Purchase Details
Closed on
Feb 23, 2022
Sold by
Markijohn Nicholas P
Bought by
Markijohn Amy R
Current Estimated Value
Home Financials for this Owner
Home Financials are based on the most recent Mortgage that was taken out on this home.
Original Mortgage
$209,000
Outstanding Balance
$167,642
Interest Rate
3.15%
Mortgage Type
New Conventional
Estimated Equity
$230,344
Purchase Details
Closed on
Oct 20, 2009
Sold by
Nvr Inc
Bought by
Markijohn Nicholas P
Home Financials for this Owner
Home Financials are based on the most recent Mortgage that was taken out on this home.
Original Mortgage
$239,112
Interest Rate
4.96%
Mortgage Type
FHA
Purchase Details
Closed on
Sep 1, 2009
Sold by
Mortell Associates
Bought by
Nvr Inc
Home Financials for this Owner
Home Financials are based on the most recent Mortgage that was taken out on this home.
Original Mortgage
$239,112
Interest Rate
4.96%
Mortgage Type
FHA
Create a Home Valuation Report for This Property
The Home Valuation Report is an in-depth analysis detailing your home's value as well as a comparison with similar homes in the area
Home Values in the Area
Average Home Value in this Area
Purchase History
| Date | Buyer | Sale Price | Title Company |
|---|---|---|---|
| Markijohn Amy R | -- | None Listed On Document | |
| Markijohn Nicholas P | $243,800 | Accommodation | |
| Nvr Inc | $50,000 | Chicago Title Insurance Co |
Source: Public Records
Mortgage History
| Date | Status | Borrower | Loan Amount |
|---|---|---|---|
| Open | Markijohn Amy R | $209,000 | |
| Previous Owner | Markijohn Nicholas P | $239,112 |
Source: Public Records
Tax History Compared to Growth
Tax History
| Year | Tax Paid | Tax Assessment Tax Assessment Total Assessment is a certain percentage of the fair market value that is determined by local assessors to be the total taxable value of land and additions on the property. | Land | Improvement |
|---|---|---|---|---|
| 2024 | -- | $120,910 | $30,660 | $90,250 |
| 2023 | $9,218 | $97,010 | $24,580 | $72,430 |
| 2022 | $4,976 | $97,010 | $24,580 | $72,430 |
| 2021 | $4,998 | $97,010 | $24,580 | $72,430 |
| 2020 | $4,911 | $84,360 | $21,370 | $62,990 |
| 2019 | $4,957 | $84,360 | $21,370 | $62,990 |
| 2018 | $4,492 | $70,890 | $14,740 | $56,150 |
| 2017 | $4,221 | $70,890 | $14,740 | $56,150 |
| 2016 | $3,879 | $70,890 | $14,740 | $56,150 |
| 2015 | $3,627 | $70,890 | $14,740 | $56,150 |
| 2014 | $3,694 | $70,890 | $14,740 | $56,150 |
| 2013 | $3,694 | $70,890 | $14,740 | $56,150 |
Source: Public Records
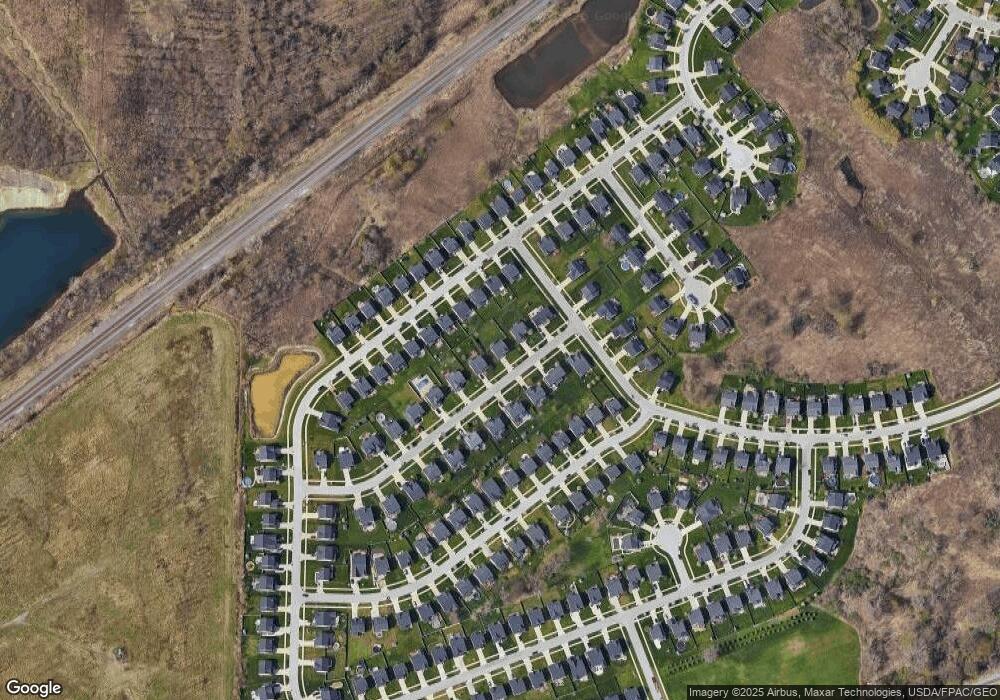
Map
Nearby Homes
- 1770 N Ashwood Ln
- 1997 Spruce Ln
- 1958 S Ashwood Ln
- 1714 W Jackson St
- 1703 W Jackson St
- 549 Walker Ln
- 0 W Jackson St Unit 5103770
- 0 W Jackson St Unit 5156332
- 146 Garfield Dr
- 384 Roberta Dr
- 433 Roberta Dr
- 401 Roberta Dr
- 113 Palm Ct
- 180 Clairmont Dr
- 591 Cherrywood Ln
- 6509 Hudson Ave
- 1936 Mentor Ave
- 1651 Mentor Ave Unit 2008
- 1651 Mentor Ave Unit 2804
- 1651 Mentor Ave Unit 1706
- 1849 Pinewood Ln
- 1871 Pinewood Ln
- 1862 N Ashwood Ln
- 1870 N Ashwood Ln
- 1883 Pinewood Ln
- 1837 Pinewood Ln
- 1840 N Ashwood Ln
- 1882 N Ashwood Ln
- 1850 Pinewood Ln
- 1862 Pinewood Ln
- 1872 Pinewood Ln
- 1830 N Ashwood Ln
- 1893 Pinewood Ln
- 1890 N Ashwood Ln
- 1884 Pinewood Ln
- 1838 Pinewood Ln
- 295 N Ashwood Ln
- 464 N Ashwood Ln
- 465 N Ashwood Ln
- 1902 N Ashwood Ln