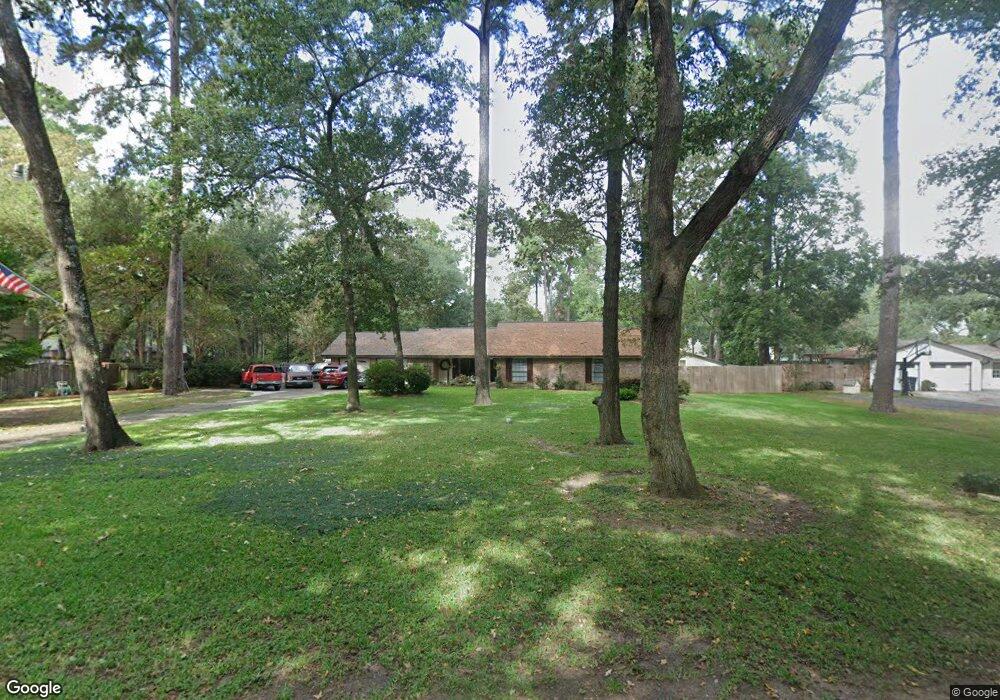
18610 Mockingbird Ln Tomball, TX 77377
Estimated Value: $386,127 - $460,000
3
Beds
3
Baths
2,012
Sq Ft
$212/Sq Ft
Est. Value
About This Home
This home is located at 18610 Mockingbird Ln, Tomball, TX 77377 and is currently estimated at $427,032, approximately $212 per square foot. 18610 Mockingbird Ln is a home located in Harris County with nearby schools including Rosehill Elementary School, Tomball Intermediate School, and Tomball Junior High School.
Ownership History
Date
Name
Owned For
Owner Type
Purchase Details
Closed on
Nov 14, 1997
Sold by
Morris W Gorman and Morris Theresa
Bought by
Duffy Timothy S and Duffy Cynthia A Thurnau
Current Estimated Value
Home Financials for this Owner
Home Financials are based on the most recent Mortgage that was taken out on this home.
Original Mortgage
$129,105
Outstanding Balance
$18,910
Interest Rate
7.28%
Estimated Equity
$408,122
Purchase Details
Closed on
Dec 16, 1996
Sold by
Walker Michael W
Bought by
Morris W Gorman and Morris Theresa
Home Financials for this Owner
Home Financials are based on the most recent Mortgage that was taken out on this home.
Original Mortgage
$24,500
Interest Rate
7.6%
Purchase Details
Closed on
Jun 1, 1994
Sold by
Terrell William F and Terrell Mary F
Bought by
Morris W Gorman and Morris Theresa
Home Financials for this Owner
Home Financials are based on the most recent Mortgage that was taken out on this home.
Original Mortgage
$84,000
Interest Rate
8.45%
Create a Home Valuation Report for This Property
The Home Valuation Report is an in-depth analysis detailing your home's value as well as a comparison with similar homes in the area
Purchase History
| Date | Buyer | Sale Price | Title Company |
|---|---|---|---|
| Duffy Timothy S | -- | Regency Title | |
| Morris W Gorman | -- | Title Agency #50 | |
| Morris W Gorman | -- | Title Agency #50 |
Source: Public Records
Mortgage History
| Date | Status | Borrower | Loan Amount |
|---|---|---|---|
| Open | Duffy Timothy S | $129,105 | |
| Previous Owner | Morris W Gorman | $24,500 | |
| Previous Owner | Morris W Gorman | $84,000 |
Source: Public Records
Tax History
| Year | Tax Paid | Tax Assessment Tax Assessment Total Assessment is a certain percentage of the fair market value that is determined by local assessors to be the total taxable value of land and additions on the property. | Land | Improvement |
|---|---|---|---|---|
| 2025 | $5,631 | $374,240 | $89,140 | $285,100 |
| 2024 | $5,631 | $372,493 | $87,393 | $285,100 |
| 2023 | $5,631 | $356,883 | $87,393 | $269,490 |
| 2022 | $6,203 | $327,276 | $78,653 | $248,623 |
| 2021 | $5,828 | $273,748 | $78,653 | $195,095 |
| 2020 | $5,476 | $247,277 | $61,175 | $186,102 |
| 2019 | $5,183 | $228,408 | $43,696 | $184,712 |
| 2018 | $2,431 | $206,400 | $43,696 | $162,704 |
| 2017 | $4,630 | $206,400 | $43,696 | $162,704 |
| 2016 | $4,630 | $206,400 | $43,696 | $162,704 |
| 2015 | $3,735 | $206,400 | $43,696 | $162,704 |
| 2014 | $3,735 | $207,062 | $43,696 | $163,366 |
Source: Public Records
Map
Nearby Homes
- 22911 Wren Ln
- 18238 Balsam Fields Ln
- 18230 Ln
- 18214 Balsam Fields Dr
- 18218 Dr
- 22514 Tamarack Valley Ln
- 22742 Timberlake Creek Rd
- 18314 Hidden Dahlia Dr
- 22507 Pinecone Forest Ln
- 18310 Hidden Dahlia Dr
- 18211 Spruce Cottage Dr
- 18303 Hidden Dahlia Dr
- 17850 Cappadocia Trail
- 17851 Cappadocia Trail
- 17822 Pamukkale Place
- 17814 Pamukkale Place
- 17823 Cappadocia Trail
- 17722 Hattusas Ln
- 18310 Yaupon Bough Ln
- 22303 Hawberry Blossom Ln
- 18606 Mockingbird Ln
- 18607 Tanager Ln
- 22802 Rosehollow Trail
- 18614 Mockingbird Ln
- 18602 Mockingbird Ln
- 18603 Tanager Ln
- 18607 Mockingbird Ln
- 22734 Rosehollow Trail
- 18610 Tanager Ln
- 18606 Tanager Ln
- 18603 Mockingbird Ln
- 18703 Quail Ln
- 18702 Quail Ln
- 18706 Mockingbird Ln
- 22803 Wren Ln
- 18602 Tanager Ln
- 18610 Hummingbird Ln
- 22900 Rosehollow Trail
- 18606 Hummingbird Ln
- 18706 Quail Ln
Your Personal Tour Guide
Ask me questions while you tour the home.