1862 Springdale Rd Unit 1872 Cincinnati, OH 45231
New Burlington NeighborhoodEstimated Value: $158,000 - $192,223
4
Beds
1
Bath
1,060
Sq Ft
$166/Sq Ft
Est. Value
About This Home
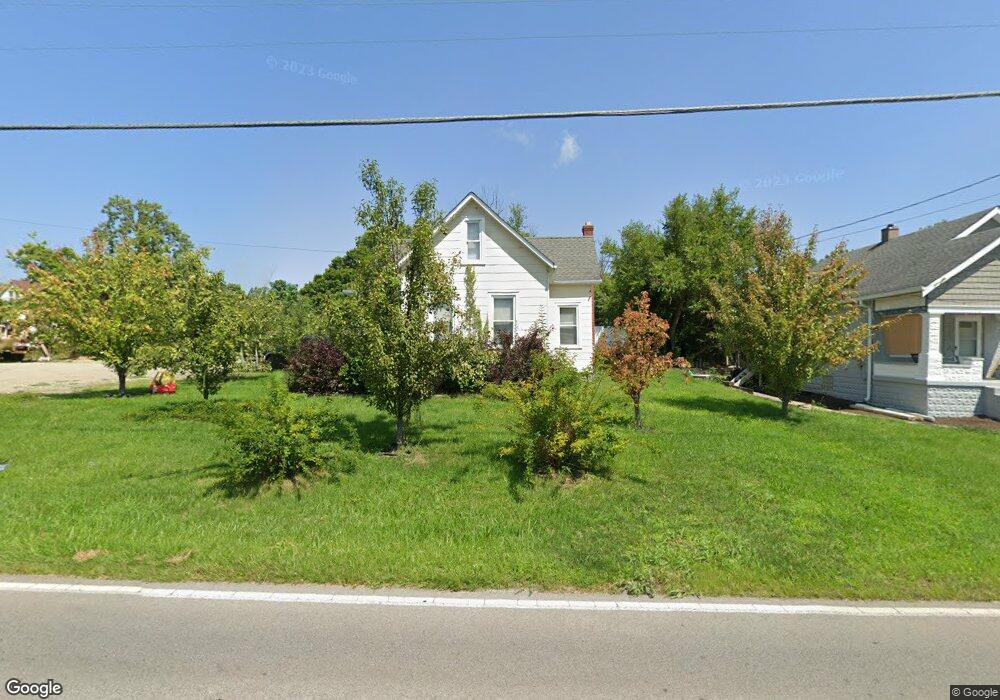
This home is located at 1862 Springdale Rd Unit 1872, Cincinnati, OH 45231 and is currently estimated at $175,556, approximately $165 per square foot. 1862 Springdale Rd Unit 1872 is a home located in Hamilton County with nearby schools including Mt Healthy High School, Hamilton County Mathematics and Science Academy, and Central Montessori Academy.
Ownership History
Date
Name
Owned For
Owner Type
Purchase Details
Closed on
Jan 27, 2022
Sold by
Rc Properties Enterprise Llc
Bought by
J & J Houseworks Llc
Current Estimated Value
Purchase Details
Closed on
Dec 23, 2021
Sold by
Moeller Herbert L
Bought by
Rc Properties Enterprise Llc
Purchase Details
Closed on
Sep 7, 2021
Sold by
Hager Thomas F and Hager Monica L
Bought by
Moeller Herbert L
Purchase Details
Closed on
Dec 15, 2020
Sold by
1872 Springdale Llc
Bought by
Hager Thomas F and Hager Monica L
Purchase Details
Closed on
Oct 16, 2014
Sold by
Sosc1 Llc
Bought by
1872 Springdale Llc
Purchase Details
Closed on
Oct 9, 2014
Sold by
Jmw Plumbing Llc
Bought by
Sosc1 Llc
Purchase Details
Closed on
Jun 29, 2007
Sold by
Reading Feed Mill Inc
Bought by
Jmw Plumbing Llc
Create a Home Valuation Report for This Property
The Home Valuation Report is an in-depth analysis detailing your home's value as well as a comparison with similar homes in the area
Home Values in the Area
Average Home Value in this Area
Purchase History
| Date | Buyer | Sale Price | Title Company |
|---|---|---|---|
| J & J Houseworks Llc | $124,250 | Prodigy Title | |
| Rc Properties Enterprise Llc | $125,000 | Prodigy Title | |
| Moeller Herbert L | -- | None Available | |
| Hager Thomas F | -- | None Available | |
| 1872 Springdale Llc | -- | Attorney | |
| Sosc1 Llc | $33,000 | None Available | |
| Jmw Plumbing Llc | $42,500 | Attorney |
Source: Public Records
Tax History Compared to Growth
Tax History
| Year | Tax Paid | Tax Assessment Tax Assessment Total Assessment is a certain percentage of the fair market value that is determined by local assessors to be the total taxable value of land and additions on the property. | Land | Improvement |
|---|---|---|---|---|
| 2024 | $2,500 | $40,884 | $13,808 | $27,076 |
| 2023 | $2,334 | $40,884 | $13,808 | $27,076 |
| 2022 | $682 | $8,492 | $4,267 | $4,225 |
| 2021 | $679 | $8,492 | $4,267 | $4,225 |
| 2020 | $671 | $8,492 | $4,267 | $4,225 |
| 2019 | $572 | $6,685 | $3,360 | $3,325 |
| 2018 | $574 | $6,685 | $3,360 | $3,325 |
| 2017 | $554 | $6,685 | $3,360 | $3,325 |
| 2016 | $568 | $6,685 | $3,059 | $3,626 |
| 2015 | $1,007 | $12,086 | $3,059 | $9,027 |
| 2014 | $1,000 | $12,086 | $3,059 | $9,027 |
| 2013 | $1,074 | $13,279 | $3,360 | $9,919 |
Source: Public Records
Map
Nearby Homes
- 1917 Springdale Rd
- 1763 Springdale Rd
- 10410 Maria Ave
- 1662 Springdale Rd
- 10443 Burlington Rd
- 2000 Struble Rd
- 10467 Mill Rd
- 10493 Mill Rd
- 10525 Mill Rd
- 10591 Wellingwood Ct
- 1762 Lockbourne Dr
- 1717 Aspenhill Dr
- 1805 Miles Rd
- 10359 Hawkhurst Dr
- 10242 Chippenham Ct
- 10216 Hawkhurst Dr
- 1629 Miles Rd
- 1890 Lotushill Dr
- 10804 Sprucehill Dr
- 9933 Grasscreek Ct
- 1862 Springdale Rd
- 1852 Springdale Rd
- 1872 Springdale Rd
- 10336 Faske Dr
- 10326 Faske Dr
- 1880 Springdale Rd
- 10373 Maria Ave
- 10352 Faske Dr
- 1830 Springdale Rd
- 10379 Maria Ave
- 10368 Maria Ave
- 10364 Faske Dr
- 1847 Springdale Rd
- 1897 Springdale Rd
- 1904 Springdale Rd
- 1812 Springdale Rd
- 1837 Springdale Rd
- 10383 Maria Ave
- 10372 Maria Ave
- 10376 Faske Dr