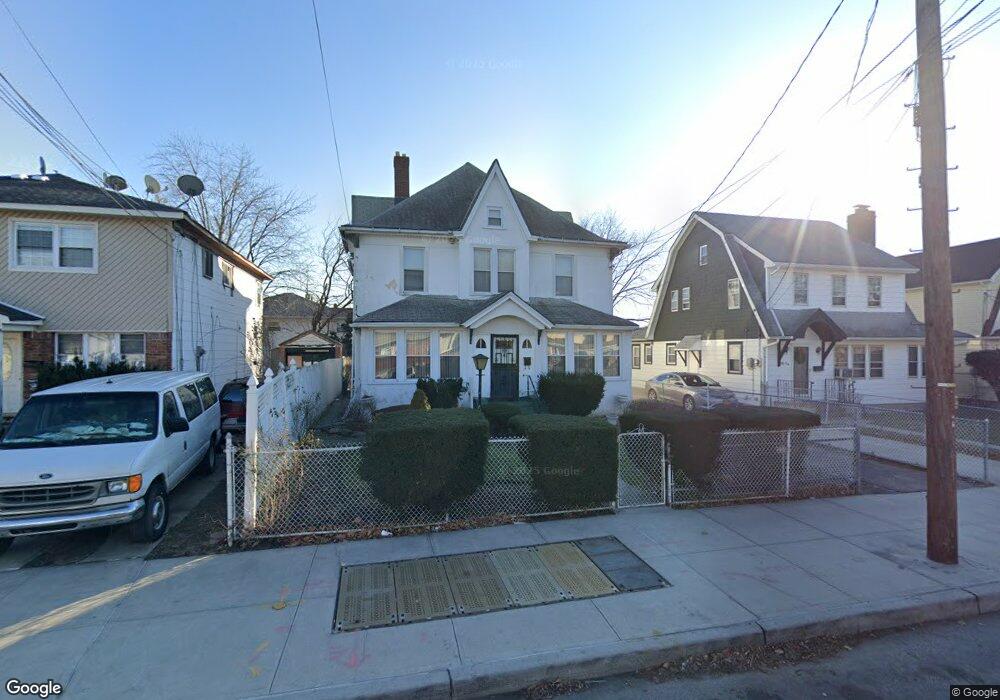
18620 104th Ave Saint Albans, NY 11412
Hollis NeighborhoodEstimated Value: $733,000 - $963,000
--
Bed
--
Bath
2,100
Sq Ft
$400/Sq Ft
Est. Value
About This Home
This home is located at 18620 104th Ave, Saint Albans, NY 11412 and is currently estimated at $839,635, approximately $399 per square foot. 18620 104th Ave is a home located in Queens County with nearby schools including P.S. 118 Lorraine Hansberry, I.S. 192 The Linden, and Wellspring Elementary & Middle.
Ownership History
Date
Name
Owned For
Owner Type
Purchase Details
Closed on
Jul 8, 2025
Sold by
Fauntleroy Deceased Mary and Fauntleroy Deceased
Bought by
18620 Holdings Llc
Current Estimated Value
Purchase Details
Closed on
Jun 5, 2025
Sold by
Fauntleroy Deceased Mary and Fauntleroy Deceased
Bought by
18620 Holdings Llc
Purchase Details
Closed on
May 29, 2025
Sold by
Fauntleroy Haqq Surviving Heir Nina and Fauntleroy Deceased
Bought by
18620 Holdings Llc
Purchase Details
Closed on
Feb 24, 1997
Sold by
Spring Equities Inc
Bought by
Fauntleroy William A and Fauntleroy Mary
Home Financials for this Owner
Home Financials are based on the most recent Mortgage that was taken out on this home.
Original Mortgage
$150,000
Interest Rate
7.77%
Purchase Details
Closed on
Oct 24, 1996
Sold by
Lark Amander D
Bought by
Spring Equities Inc
Purchase Details
Closed on
Jul 24, 1996
Sold by
Clark Thomas and Clark Amanda
Bought by
Spring Equities Inc
Create a Home Valuation Report for This Property
The Home Valuation Report is an in-depth analysis detailing your home's value as well as a comparison with similar homes in the area
Home Values in the Area
Average Home Value in this Area
Purchase History
| Date | Buyer | Sale Price | Title Company |
|---|---|---|---|
| 18620 Holdings Llc | $500 | -- | |
| 18620 Holdings Llc | $500 | -- | |
| 18620 Holdings Llc | $1,000 | -- | |
| Fauntleroy William A | $215,000 | American Title Ins Co | |
| Fauntleroy William A | $215,000 | American Title Ins Co | |
| Spring Equities Inc | $108,000 | -- | |
| Spring Equities Inc | $108,000 | -- | |
| Spring Equities Inc | $108,000 | American Title Ins Co | |
| Spring Equities Inc | $108,000 | American Title Ins Co |
Source: Public Records
Mortgage History
| Date | Status | Borrower | Loan Amount |
|---|---|---|---|
| Previous Owner | Fauntleroy William A | $150,000 |
Source: Public Records
Tax History Compared to Growth
Tax History
| Year | Tax Paid | Tax Assessment Tax Assessment Total Assessment is a certain percentage of the fair market value that is determined by local assessors to be the total taxable value of land and additions on the property. | Land | Improvement |
|---|---|---|---|---|
| 2025 | $6,501 | $32,486 | $14,821 | $17,665 |
| 2024 | $6,501 | $32,365 | $15,045 | $17,320 |
| 2023 | $6,272 | $31,225 | $14,634 | $16,591 |
| 2022 | $5,881 | $41,880 | $20,640 | $21,240 |
| 2021 | $4,369 | $41,880 | $20,640 | $21,240 |
| 2020 | $4,055 | $42,480 | $15,420 | $27,060 |
| 2019 | $3,979 | $46,800 | $15,420 | $31,380 |
| 2018 | $3,667 | $26,021 | $10,531 | $15,490 |
| 2017 | $3,836 | $24,549 | $12,180 | $12,369 |
| 2016 | $3,653 | $24,549 | $12,180 | $12,369 |
| 2015 | $2,101 | $22,560 | $14,088 | $8,472 |
| 2014 | $2,101 | $22,476 | $16,827 | $5,649 |
Source: Public Records
Map
Nearby Homes
- 102-35 187th St
- 10211 187th St
- 10220 189th St
- 187-23 Brinkerhoff Ave
- 185-05 Henderson Ave
- 102-13 183rd Place
- 184-15 Henderson Ave
- 10533 Farmers Blvd
- 190-30 103rd Ave
- 19027 109th Rd
- 10532 192nd St
- 183-09 Dunlop Ave
- 183-29 Brinkerhoff Ave
- 183-12 Elmira Ave
- 188-14 Woodhull Ave
- 104-40 194th St
- 193-21 109th Rd
- 194-10 Hollis Ave
- 183-34 Fonda Ave
- 111-06 Farmers Blvd
- 18624 104th Ave
- 18616 104th Ave
- 10412 187th St
- 18626 104th Ave
- 18610 104th Ave
- 10414 187th St
- 18608 104th Ave
- 18608 104th Ave
- 187-02 104th Ave
- 187-02 104th Ave Unit 1
- 187-03 104 Avenue Ave
- 187-03 104th Ave
- 10418 187th St
- 18606 104th Ave
- 18606 104th Ave
- 104-18 187th St Unit house
- 104-18 187th St
- 10411 186th St
- 18604 104th Ave